
J_Bus_Account_Financ_Perspect 2020, 2(3), 20; doi:10.35995/jbafp2030020
Glamorous Acquisitions in Telecommunications after the Market Liberalisation: Success or Failure?
1
Universidad Nacional de Educación a Distancia (UNED), Madrid, Spain
2
Polytechnic University of Madrid, Madrid, Spain; silvia.serrano@upm.es
*
Corresponding author: jnavio@cee.uned.es (J.N.-M.); msolorzano@cee.uned.es (M.S.-G.)
How to cite: Julio Navío-Marco, Silvia Serrano Calle, Marta Solórzano-García. Glamorous Acquisitions in Telecommunications after the Market Liberalisation: Success or Failure?. J. Bus. Account. Financ. Perspect., 2020, 2(3): 20; doi:10.35995/jbafp2030020.
Received: 10 March 2020 / Accepted: 11 August 2020 / Published: 29 August 2020
Abstract
:The academic literature indicates that “glamour” influences the investor’s behaviour. This article analyses the performance and value creation of the glamorous operations of mergers and acquisitions (M&A) in the telecommunications sector, trying to understand if these operations are conducive to stockholder wealth maximization. To conduct this analysis, the telecommunications M&A that occurred in the convulsed period of the internet bubble were counted as samples (1995–2010). The research concludes that glamour tends to be opposite to value creation in the long run: the glamour firms show significant value destruction and worse performance than non-glamour firms. Certain acquirers’ characteristics, such as size, are determinant in the glamour behaviour. This paper combats the shortage of research of a quantitative sectoral nature on telecommunications M&As, when leading international companies like Vodafone, Cable and Wireless, France Telecom or Telecom Italia are very active in this kind of operations.
Keywords:
M&A; glamorous acquisitions; strategy; telecommunications; CTAR1. Introduction
Glamour acquirers are those firms that are highly valued in the stock markets as a result of their prior stock market performance (Sudarsanam and Mahate, 2003). Their stocks receive premium ratings in the form of market value to book value ratio, or reversely a low book-to-market ratio (Hashem and Su, 2015). In contrast, firms with high book-to-market ratio ratings are undervalued, but may have the potential for subsequent value gains. In their landmark seminal researches, Fama and French (1992, 1996) argue that the book-to-market ratio is a risk proxy. Value stocks are regarded as more risky than glamour stocks and thus can be expected to out-perform glamour stocks. Some research highlights the tendency of “value” stocks to outperform “glamour” firms (Piotroski and So, 2012) as glamour portfolios consist of an excessive share of overvalued firms and value portfolios contain a disproportionate share of undervalued companies, but many investors are more likely to shift their investment toward ‘good’ or ‘glamour’ equity rather than basing their investment decisions on objective risk characteristics, especially for banks and mutual funds (Andriosopoulos et al., 2016; Del Guercio, 1996). Some researchers recognize also (Sudarsanam and Mahate, 2003) that glamour stocks are high growth and value stocks are low growth firms, since their high market valuation may reflect the expected high growth or investment opportunities.
The literature includes a large number of examples showing diverted behaviours of the glamour stocks: negative long-run returns following mergers and acquisitions (M&A) announcements are found in most of the cases (Kohers and Kohers, 2001; Rau and Vermaelen, 1998) but Mitchell and Stafford (2000) report that both growth and value acquirers have abnormal performance that is insignificantly different from zero and from each other. Therefore, the returns and the source of these return differential remains a subject of considerable debate (Piotroski and So, 2012).
On the other hand, the telecommunications sector, one of the most active and dynamic sectors of the economy, experienced profound strategic changes that began at the end of the 20th century and continue now in the 21st century (Eliassen et al., 2013; Girdzijauskas and Štreimikiene, 2009) with an intensive activity in M&A (Krolikowski and Okoeguale, 2018). Despite the increasing interest in this sector, there is an observable shortage of statistical and econometric analyses of a sectoral nature in telecommunications M&A (Navio-Marco et al., 2016), and the researches of the strategic impact of glamour M&A in this sector are nonexistent. Our study tries to fill this gap of research. Many companies in this industry are behaving outstandingly in the markets and can be catalogued as glamorous, so it is worth analysing if this glamour conducts to performance and value creation. Additionally, the period of study was selected due to its importance in telecommunications history. It comprises the immediate year after the sector liberalisation and the Internet bubble. As “bubbles” are rarely analysed in scholar papers (Lacalle, 2018), the analysis is of special interest.
Considering this situation, this paper reviews the performance of glamour acquirers in the telecommunication sector, evaluating their glamorous M&A strategy and delving into the determinants of success or failure of this strategy and the implications it has in the acquirer company. This research examines the general question of whether low book-to-market acquisitions have more favorable impacts on the performance of acquiring companies than value acquisitions, the influence on these results of organizational behavioural patterns that can differentiate glamour acquirers from value ones and the implications of these organizational decisions.
The present study comprises four sections. After the introduction, Section 2 reviews the literature about the concept and performance of glamour acquirers. Section 3 presents the empirical analysis of the glamorous telecom M&A between 2000 and 2010. Finally, Section 4 contains the conclusions of the paper and its implications for the telecom sectoral strategy, as well as its limitations and future avenues of research.
2. Literature Review about Glamorous M&A. Performance and Motivations
In their seminal work, Fama and French (1992) documented that two variables, market equity (ME) and the ratio of book equity to market equity (BE/ME) capture much of the cross-section of average stock returns. The book-to-market ratio subsumes the predictive power of other valuation ratios, and reflects compensation for financial distress risk. Consistent with this risk-based interpretation, Fama and French (1993, 1996) and Penman (1996) supported an inverse relation between book-to-market portfolios, future earnings, and future growth rates.
In the literature, glamour acquirers are a group of firms identified as likely underperformers in the years post-acquisition (Donnelly and Hajbaba, 2014; Lakonishok et al., 1994; Rau and Vermaelen, 1998). The latter authors report that, glamour acquirers generate negative abnormal returns following an acquisition. However, value acquirers achieve positive abnormal returns over the same period. These results are supported by Sudarsanam and Mahate (2003) and Gregory and Matatko (2005). Lakonishok et al. (1994) document that book-to-market ratios are positively related to future changes in earnings, changes in cash flows, and revenue growth, while LaPorta (1996) document that the one-year-ahead earnings announcement period returns to glamour firms are negative.
Among the factors influencing the glamorous M&A, Andriosopoulos et al. (2016) find indications about the possible role of company size in glamour acquisitions, suggesting that glamour acquirers are smaller in size, have lower leverage and higher cash ratios. In general, among the factors influencing the success of M&A, size is one of the included, well-studied ones (Akhigbe and Madura, 1999; Kallunki et al., 2009; Benou et al., 2007).
Furthermore, as glamour is linked also with reputation and firm recognition, companies with high market-to-book ratios are subject to higher information asymmetries because a large proportion of their market value comes from intangible assets (Moeller et al., 2004; Hutt, 2016; Allee, 2000). Currently, practitioners are increasingly examining the role of cultural and intangible factors (Hofstede, 1980; Malekzadeh and Nahavandi, 1990). Srinivasan and Hanssens (2009) cite several studies that may be considered related to intangibles, indicating the positive relationship between stock returns and brand valuation, but they relate them to stock market evolution rather than potential abnormal returns. Additionally, Berry (2006) indicates that it has been found that the international investments of companies are only valued in the presence of intangible assets in technology.
Regarding the analysis of motivations in glamour acquisitions, the reasons generally given to justify these operations, and their potential underperformance relative to value stocks in the long run, includes hubris and mispricing (Malmendier and Tate, 2008; Doukas and Petmezas, 2007). The positive expectation of future growth allows glamour acquirers to make value-decreasing acquisitions for which the market may not penalize them (Sudarsanam and Mahate, 2003; Andriosopoulos et al., 2016). This is in line with the hypothesis that managerial hubris plays an important role in the decision-making process of glamour acquirer firms when managers may be overconfident about their ability to manage an M&A deal. As these firms shows low book-to market rations, they are more likely to be overvalued (Dong et al., 2006). Managers of glamour firms may know that their shares are trading at unsustainable levels and will try to convert shares into real assets. This is one of the reasons why glamour acquirers prefer to make share payments for acquiring firms (Rau and Vermaelen, 1998; Sudarsanam and Mahate, 2003).
Consequently, we hypothesized that glamour is negatively associated to performance in this kind of M&A operation in the telecommunications sector, while the acquirer’s size and intangibles are positively related to performance.
3. Empirical Analysis
To conduct this analysis, telecommunications M&A that occurred between 1995 and 2010 were preselected as samples from the Thomson Reuters One-Banker database. In addition, data were collected from CRSP database of monthly listings and stock market data. Financial information was obtained from S&P’s COMPUSTAT database. The information dispersed among the databases were homogenized manually to include all of the information related to the merger and the firms involved.
We obtained results for a decade (2000–2010) and involves previous years’ data for “training” portfolios comparison, which had to be constructed and renewed in a 3-year timeframe before and after analyzing the abnormal returns for each M&A, as required by the selected methodology to quantify the value creation.
3.1. Method of Analysis
A significant effort has been made in recent years to refine the study methods that emerged in the 1990s to assess abnormal returns evaluation in the long run (Agrawal and Jaffe, 2000; Fama and French, 1993; Barber and Lyon, 1997). Currently, three fundamental methodologies are used to analyse returns:
- Buy-and-hold abnormal returns (BHAR);
- Cumulative abnormal returns (CAR);
- Calendar-time portfolio approach (CTAR).
This study opted for the CTAR. This long-term return analysis methodology (Jaffe, 1974) consists of constructing a portfolio in which each calendar month is composed of all of the firms that in the preceding months have experienced a specific event, where refers to the length of the event study period. The portfolio is modified every month to eliminate the firms that reach the end of the analysis period of months and to add firms that have undergone a merger or acquisition in the preceding month. For month , the performance of the calendar time portfolio is calculated as the mean of the return of the sample firms that have experienced the event in the 12, 18, 24 or 36 preceding months, depending on the horizon under analysis.
Compared to the other analysed methodologies (e.g., BHARs and CARs), the CTAR offers a significant advantage. During the construction of the portfolios, the variance in each of the periods automatically incorporated the cross-sectional correlation of the individual returns of the sample firms. Using this approach, benchmark portfolios were established as a basis for comparison. Six portfolios each month were used. Previous years’ data was required for “training” the comparison portfolios, which had to be constructed and renewed in a three-year timeframe before analysing the abnormal returns for each M&A, as required by the selected methodology to quantify the value creation.
Potential extraneous factors that might affect long-term results are methodologically avoided using the method of reference portfolio construction. Given the construction of the portfolio using the CTAR, the cross-sectional correlation of the sample firms’ returns was automatically incorporated by the variance in each of the periods. Although statistically this approach could introduce heteroskedasticity, this challenge was also addressed and resolved.
In addition to the calculation of the abnormal returns for each the operation, this research has used for the analysis acquirer’s characteristics (size, capital, intangible assets, EBIT, experience, domestic/cross border), deal characteristics including temporal variables (date, time between acquisitions, M&A wave of the operation, number of acquisitions, first acquisition/non-first acquisition). Additionally, a dichotomist variable (glamour) has been constructed indicating low or high values of the book-to-market ratio.
3.2. Empirical Results and Discussion
After calculating the book-to-market ratio, the firm sample of the M&A used contains 162 samples, 69 were classified as “glamour” acquirers and the others 93 as non “glamour” firms. The sample size is comparable to or exceeds the size normally used in the studies of M&A.
The effect of “glamour” firms has been analyzed considering the CTAR variables (calendar portfolio abnormal returns) for 3, 6, 12, 24 and 36 months, in all cases considering equally weighted portfolios (Table 1). A test of normality for these variables combining the standard asymmetry error, and the standard error of kurtosis reported in the statistics. Table 1, shows that it cannot be rejected the hypothesis that these variables are not normally distributed. In order to avoid the problems that heteroscedasticity can generate, we have used a comparison portfolio creation rule that mitigates it (Mitchell and Stafford, 2000; Ecker, 2008). Additionally, we have used HAC errors, which are also robust in the presence of heteroscedasticity.
In Table 2, it can be observed how, beginning with a situation of positive cumulative returns in the short run, they gradually decrease as the time horizon increases and become negative. As time passes and becomes more long term, the values continue to increase with negative sign, reaffirming our conclusion regarding long-term value destruction and demonstrating the different results that are obtained when short-term value creation versus long-term value creation is analyzed. The results are significant after 24 months (p-value < 0.05). This evolution is more evident in the case of glamour firms, destroying value for all the period with bigger values (in absolute terms) than the complete sample.
The value destruction is significative for glamour firm for different time frames: 12 months (p-value < 0.05), 24 months (p-value < 0.05) and 36 months (p-value < 0.05). Nevertheless, as already anticipated, such long periods of time can introduce new factors that distort the analysis, and therefore special attention will be paid to the 12- and 24-month results.
The non-glamour firms begin with a situation of positive cumulative returns in the short run, and they also gradually decrease as the time horizon increases and become negative, but the effect is less evident than for glamour firms and the whole sample. Unfortunately, the results are not statistically significant.
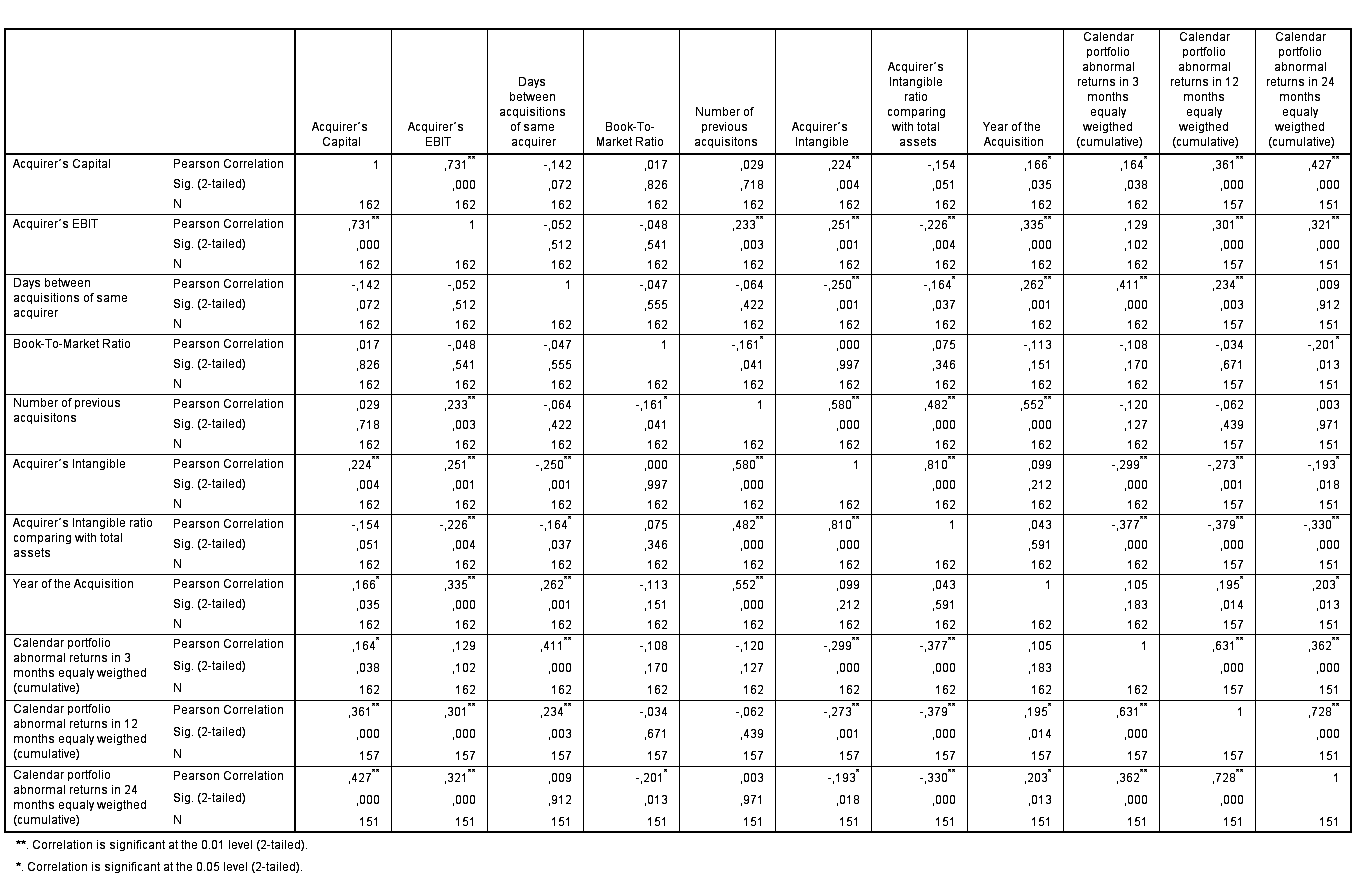
From our analysis, it is evident that certain acquirers’ characteristics are determinant of the glamour company’s success. Some of these effects can be observed in the matrix of correlations (Table 3).
The capital of the acquirer is a characteristic related to the value creation or destruction of the acquirer. This is aligned with the traditional studies (Akhigbe and Madura, 1999; Kallunki et al., 2009) studying the role of size in becoming a glamourous acquirer but introducing capital as a specific independent variable. Unfortunately, the role of the book-to-market ratio is not so evident.
In addition, the acquirer’s intangible ratio (comparing intangible assets with the total assets) and the intangible assets, are significative for the value creation/destruction for certain timeframes, coinciding with what the literature indicates (Aksoy et al., 2008). Considering that a large proportion of their market value comes from intangible assets, this result is relevant and it could be more important for the analysis than the glamour condition itself. In fact, for first acquisitions, the intangible ratio can distinguish glamour and value firms (as shown boxplots in Figure 1). In successive M&A (acquirer with experience), the relation remains unclear, but on average the glamour firm shows lower intangible ratio that the non-glamour ones.
4. Conclusions
In this study, we have examined the M&A performance in the telecommunications sector and the role of the glamour in these types of operations. The research applied a robust method (CTAR) to understand the glamour firms’ behaviour versus that of value companies and to study the factors influencing the success of these operations. This paper’s contribution to this area of research is primarily threefold: first, it further contributes to the development of M&A research in a specific area, i.e., glamour M&A, by identifying factors and patterns with relevant implications in the M&As performance. Second, this article combats the shortage of research of a quantitative sectoral nature on telecommunications M&A, when leading international companies like Vodafone, Cable and Wireless, France Telecom or Telecom Italia are very active in these types of operations. Third, this research approaches the analysis on a long-term basis, by using a longer-term performance indicator (CTAR) rather than the heavily criticised, short-term abnormal stock returns commonly used in the literature, providing clearer insights on long-term performance.
In summary, there is evidence of the progressive “negativization” of the M&A performance results, in all the cases. In other words, as we move towards long-term time horizons, we evolve towards value destruction by mergers and acquisitions in telecommunications.
We have proceeded to conduct our analysis also by selecting subsamples (glamour versus non-glamour). In addition, in all cases, with the different time horizons, the value destruction is more evident in glamour firm that in non-glamour companies, and the value destruction is significant for glamour firm in certain periods of analysis. It is possible to conclude that glamour tends to be opposite to value creation in the long run.
From our analysis, it is evident that certain acquirers’ characteristics, such as size, are determinant in the glamour behaviour. In this sense, our results are aligned with the literature (Rau and Stouraitis, 2016). Related to this, the influence of the intangible assets (and particularly the intangible ratio) is a new contribution that is worth studying as a new avenue of research.
Currently, one new area of research is the study of M&A underperformance, in terms of the cumulative dysfunctional impact that the event itself has, its associated uncertainty and consequences, and the subsequent process of integration of individual organizational members (Shrivastava, 1986). In this context, the results of this study, are timely and relevant, and contribute to fill this research gap. Undoubtedly, our study is not without shortcomings, the complexity of preparing comparison portfolios that contain a varied number of companies and are modified from month to month is a great limitation. The method is very robust, but it reduces the number of results and is not very flexible, which constrains the analysis. Despite this, we believe that the findings of our research represent an original contribution to the understanding of such a troubled period (a bubble) in the telecommunications sector.
References
- Agrawal, A.; Jaffe, J. F. The post-merger performance puzzle. In Advances in mergers and acquisitions; Cooper, C., Gregory, A., Eds.; Elsevier: Amsterdam, 2000. [Google Scholar]
- Akhigbe, A.; Madura, J. The industry effects regarding the probability of takeovers. The Financial Review 1999, 34, 1–18. [Google Scholar] [CrossRef]
- Aksoy, L.; Cooil, B.; Groening, C.; Keiningham, T.L.; Yalçın, A. The long-term stock market valuation of customer satisfaction. Journal of Marketing 2008, 72(4), 105–122. [Google Scholar]
- Allee, V. Reconfiguring the value network. Journal of Business Strategy 2000, 21(4), 36–39. [Google Scholar]
- Andriosopoulos, D.; Yang, S.; Li, W. The market valuation of M&A announcements in the United Kingdom. International Review of Financial Analysis 2016, 48, 350–366. [Google Scholar]
- Barber, B. M.; Lyon, J. D. Detecting long-run abnormal stock returns: The empirical power and specification of test statistics. Journal of Financial Economics 1997, 43, 341–372. [Google Scholar] [CrossRef]
- Benou, G.; Gleason, K. C.; Madura, J. Impact of visibility and investment advisor credibility on the valuation effects of high-tech cross-border acquisitions. Financial Management 2007, 36, 69–89. [Google Scholar]
- Berry, H. Shareholder valuation of foreign investment and expansion. Strategic Management Journal 2006, 27, 1123–1140. [Google Scholar]
- Del Guercio, D. The distorting effect of the prudent-man laws on institutional equity investments. Journal of Financial Economics 1996, 40, 31–62. [Google Scholar] [CrossRef]
- Dong, M.; Hirshleifer, D.; Richardson, S.; Teoh, S. Does investor misvaluation drive the takeover market? The Journal of Finance 2006, 61(2), 725–762. [Google Scholar] [CrossRef]
- Donnelly, R.; Hajbaba, A. The acquisition puzzle and mispricing: Evidence of over-optimism. International Journal of Managerial Finance 2014, 10(4), 470–493. [Google Scholar]
- Doukas, J. A.; Petmezas, D. Acquisitions, overconfident managers and self-attribution bias. European Financial Management 2007, 13(3), 531–577. [Google Scholar]
- Ecker, F. Information risk and long-run performance of initial public offerings; Gabler: Wiesbaden, 2008. [Google Scholar]
- Eliassen, K. A.; Nfa, M. S.; Sjovaag, M. (Eds.) European telecommunications liberalisation; Routledge: London, 2013. [Google Scholar]
- Fama, E. F.; French, K. R. The cross-section of expected stock returns. Journal of Finance 1992, 47(2), 427–465. [Google Scholar]
- Fama, E. F.; French, K. R. Common Risk Factors in the Returns on Stocks and Bonds. Journal of Financial Economics 1993, 33, 3–56. [Google Scholar]
- Fama, E. F.; French, K. R. Multifactor explanations of asset pricing anomalies. The Journal of Finance 1996, 51(1), 55–84. [Google Scholar]
- Girdzijauskas, S.; Štreimikiene, D. Application of logistic models for stock market bubbles analysis. Journal of Business Economics and Management 2009, 10(1), 45–51. [Google Scholar] [CrossRef]
- Gregory, A.; Matatko, J. Long run abnormal returns to acquiring firms: The form of payment hypothesis, bidder hostility and timing behavior; working paper; University of Exeter: Exeter, 2005. [Google Scholar]
- Hashem, N.; Su, L. Industry concentration and the cross-section of stock returns: Evidence from the UK. Journal of Business Economics and Management 2015, 16(4), 769–785. [Google Scholar] [CrossRef]
- Hofstede, G. Culture and organizations. International Studies of Management & Organization 1980, 10(4), 15–41. [Google Scholar]
- Hutt, R. W. Reputation on the line: the Starbucks cases. Journal of Business Strategy 2016, 37(1), 19–26. [Google Scholar]
- Jaffe, J. F. Special information and insider trading. Journal of Business 1974, 47, 410–428. [Google Scholar]
- Kallunki, J.-P.; Pyykkö, E.; Laamanen, T. Stock Market Valuation, Profitability and R&D Spending of the Firm: The Effect of Technology Mergers and Acquisitions. Journal of Business Finance and Accounting 2009, 36(7), 838–862. [Google Scholar]
- Kohers, N.; Kohers, T. Takeovers of technology firms: Expectations vs. reality. Financial Management 2001, 30, 35–54. [Google Scholar]
- Krolikowski, M. W.; Okoeguale, K. Economic shocks, competition and merger activity. Journal of Business Accounting and Finance Perspectives 2018, 1, 1–54. [Google Scholar] [CrossRef]
- Lacalle, D. Are the effects of unconventional monetary policy on financial markets causing bubbles. Journal of Business Accounting and Finance Perspectives 2018, 1(1), 95–117. [Google Scholar] [CrossRef]
- Lakonishok, J.; Shleifer, A.; Vishny, R. W. Contrarian investment, extrapolation, & risk. Journal of Finance 1994, 49(5), 1541–1578. [Google Scholar]
- LaPorta, R. Expectations and the Cross-section of Stock Returns. Journal of Finance 1996, 51, 1715–1742. [Google Scholar] [CrossRef]
- Malekzadeh, A. R.; Nahavandi, A. Making mergers work by managing cultures. Journal of Business Strategy 1990, 11(3), 55–57. [Google Scholar]
- Malmendier, U.; Tate, G. Who makes acquisitions? CEO overconfidence and the market’s reaction? Journal of Financial Economics 2008, 89(1), 20–43. [Google Scholar] [CrossRef]
- Mitchell, M. L.; Stafford, E. Managerial decisions and long-term stock price performance. Journal of Business 2000, 73(3), 287–329. [Google Scholar] [CrossRef]
- Moeller, S. B.; Schlingemann, F. P.; Stulz, R. M. Firm size and the gains from acquisitions. Journal of Financial Economics 2004, 73, 201–228. [Google Scholar] [CrossRef]
- Navio-Marco, J.; Solórzano-García, M.; Matilla-García, M.; Urueña, A. Language as a key factor of long-term value creation in mergers and acquisitions in the telecommunications sector. Telecommunications Policy 2016, 40, 1052–1063. [Google Scholar] [CrossRef]
- Penman, S. H. The Articulation of Price-Earnings Ratios and Market-to-book Ratios and the Evaluation of Growth. Journal of Accounting Research 1996, 34, 235–260. [Google Scholar] [CrossRef]
- Piotroski, J. D.; So, E. C. Identifying expectation errors in value/glamour strategies: A fundamental analysis approach. Review of Financial Studies 2012, 25(9), 2841–2875. [Google Scholar] [CrossRef]
- Rau, P. R.; Vermaelen, T. Glamour, value and the post-acquisition performance of acquiring firms. Journal of Financial Economics 1998, 49(2), 223–253. [Google Scholar]
- Shrivastava, P. Postmerger integration. Journal of Business Strategy 1986, 7(1), 65–76. [Google Scholar]
- Srinivasan, S.; Hanssens, D. M. Marketing and firm value: Metrics, methods, findings, & future directions. Journal of Marketing Research 2009, 46(3), 293–312. [Google Scholar]
- Sudarsanam, S.; Mahate, A. A. Glamour acquirers, method of payment and post-acquisition performance: The UK evidence. Journal of Business Finance & Accounting 2003, 30(1), 299–342. [Google Scholar]
Figure 1.
Intangible ratio for Glamour Firms and Previous acquiring experience.
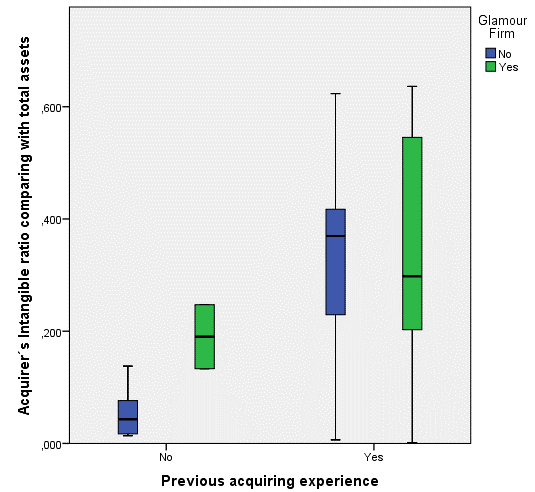

Table 1.
Descriptive Statistics.
| Glamour Firm | Book-To-Market Ratio | Calendar Portfolio Abnormal Returns in 3 Months | Calendar Portfolio Abnormal Returns in 12 Months | Calendar Portfolio Abnormal Returns in 24 Months | Calendar Portfolio Abnormal Returns in 36 Months | |
|---|---|---|---|---|---|---|
| No | N | 93 | 93 | 90 | 85 | 79 |
| Mean | 33.2287 | 0.02390 | −0.01802 | −0.09589 | −0.01454 | |
| Median | 17.5620 | 0.00898 | 0.00902 | −0.03645 | −0.12512 | |
| Standard deviation | 42.79598 | 0.218031 | 0.354588 | 0.537343 | 1.178635 | |
| Standard error of kurtosis | 0.495 | 0.495 | 0.503 | 0.517 | 0.535 | |
| Standard Asymmetry Error | 0.250 | 0.250 | 0.254 | 0.261 | 0.271 | |
| Yes | N | 69 | 69 | 67 | 66 | 62 |
| Mean | 4.6659 | −0.02057 | −0.07177 | −0.10144 | −0.32595 | |
| Median | 4.8121 | −0.01696 | −0.06586 | −0.13033 | −0.54321 | |
| Standard deviation | 1.47666 | 0.117438 | 0.254597 | 0.349683 | 1.001995 | |
| Standard error of kurtosis | 0.570 | 0.570 | 0.578 | 0.582 | 0.599 | |
| Standard Asymmetry Error | 0.289 | 0.289 | 0.293 | 0.295 | 0.304 | |
| Total | N | 162 | 162 | 157 | 151 | 141 |
| Mean | 21.0630 | 0.00496 | −0.04095 | −0.09831 | −0.15147 | |
| Median | 8.1674 | −0.00079 | −0.02834 | −0.08125 | −0.37254 | |
| Standard deviation | 35.33002 | 0.182964 | 0.316018 | 0.463344 | 1.111525 | |
| Standard error of kurtosis | 0.379 | 0.379 | 0.385 | 0.392 | 0.406 | |
| Standard Asymmetry Error | 0.191 | 0.191 | 0.194 | 0.197 | 0.204 | |
Table 2.
Long-term performance of glamour-acquiring firms.
| CTAR | CTAR GLAMOUR FIRMS | CTAR NON GLAMOUR FIRMS | |
|---|---|---|---|
| 3 Months | |||
| N | 162 | 69 | 93 |
| Mean | 0.004962 | −0.020566 | 0.023902 |
| Std. Deviation | 0.182964 | 0.117438 | 0.218031 |
| t-statistic | 0.345173 | −1.454697 | 1.057208 |
| p-value | 0.730415 | 0.150354 | 0.293185 |
| 6 Months | |||
| N | 162 | 69 | 93 |
| Mean | −0.009838 | −0.034652 | 0.008572 |
| Std. Deviation | 0.237620 | 0.182186 | 0.271059 |
| t-statistic | −0.526978 | −1.579928 | 0.304970 |
| p-value | 0.598934 | 0.118764 | 0.761078 |
| 12 Months | |||
| N | 157 | 67 | 90 |
| Mean | −0.040954 | −0.071766 | −0.018017 |
| Std. Deviation | 0.316018 | 0.254597 | 0.354588 |
| t-statistic | −1.623820 | −2.307299 | −0.482024 |
| p-value | 0.106433 | 0.024183 | 0.630972 |
| 24 Months | |||
| N | 151 | 66 | 85 |
| Mean | −0.098314 | −0.101442 | −0.095885 |
| Std. Deviation | 0.463344 | 0.349683 | 0.537343 |
| t-statistic | −2.607351 | −2.356753 | −1.645165 |
| p-value | 0.010046 | 0.021459 | 0.103673 |
| 36 Months | |||
| N | 141 | 62 | 79 |
| Mean | −0.151469 | −0.325946 | −0.014538 |
| Std. Deviation | 1.111525 | 1.001995 | 1.178635 |
| t-statistic | −1.618136 | −2.561390 | −0.109635 |
| p-value | 0.107884 | 0.012914 | 0.91291 |
Null hypothesis: population mean = 0.
Table 3.
Correlations Matrix.
© 2020 Copyright by the authors. Licensed as an open access article using a CC BY 4.0 license.