
J_Bus_Account_Financ_Perspect 2021, 3(1), 8; doi:10.35995/jbafp3010008
Combining Economic and Cultural Perspectives on NPL Analysis: A Case Study
1
M.Sc in Banking, Hellenic Open University, Greece; pan.kritikou@gmail.com
2
Ass Prof. of Development Finance, Department of Economics, National and Kapodistrian University of Athens, Greece
3
Visiting Professor, Department of Economics, National and Kapodistrian University of Athens, Greece; kstoudas@econ.uoa.gr
*
Corresponding author: pboufounou@econ.uoa.gr
How to cite: Panagiota Kritikou, Paraskevi Boufounou, Kanellos Toudas. Combining Economic and Cultural Perspectives on NPL Analysis: A Case Study. J. Bus. Account. Financ. Perspect., 2021, 3(1): 8; doi:10.35995/jbafp3010008.
Received: 17 March 2021 / Accepted: 5 July 2021 / Published: 16 July 2021
Peer review
: This article has been peer-reviewed through the journal’s standard double blind peer-review, where both the reviewers and authors are anonymised during review.Open access
: Journal of Business Accounting and Finance Perspectives is a peer-reviewed open-access journal.Abstract
:This paper attempts to empirically investigate and interpret the NPLs of EU countries based on a combination of economic and socio-cultural characteristics, as depicted by Hofstede’s “6 Cultural Dimensions”. Estimates are made for the period 2000–2019 for eight EU countries, four of which are in Southern Europe (Greece, Italy, Spain, Portugal) and four are in Central Europe (Germany, France, the Netherlands and Belgium). Special emphasis is placed on Greece, due to the importance of NPLs in this country. The findings are in accordance with those of previous relevant research, and the combination of economic and cultural characteristics provided a more in-depth NPL analysis.
Keywords:
cultural background; NPLs; economic factors; Hofstede dimensions1. Introduction
The current economic crisis and its consequences have created a large number of non-performing loans, which have affected and continue to negatively affect banks, thus negatively affecting the recovery and growth potential of countries, and according to the European Central Bank’s banking supervision. NPLs to total loans ratio, is among countries’ growth indicators. A question has arisen as to why some European countries face a greater problem of increasing non-performing loans, while others do not. What factors trigger the NPL phenomenon? The most relevant studies show that the increase in non-performing loans (NPLs) is influenced by economic factors, even during crises. Other recent studies attribute the increase in NPLs to socio-cultural characteristics using Hoftsede’s model (as detailed in the literature section below).
The present paper’s goal is to explore whether the combination of economic and socio-cultural characteristics could provide a more holistic framework for enlightening NPL development in the EU. As shown in Figure 1 below, the evolution of NPLs over time as a percentage of gross total loans for the central countries of the European Union (i.e., Germany, France, the Netherlands and Belgium) seems to follow a relatively common pattern, in contrast with the countries of the Southern Europe (Portugal, Greece, Italy, and Spain—PIGS). Therefore, eight EU countries were studied in two groups: (a) Southern Europe (four countries, including Greece) and (b) Central Europe (four countries) for the period 2000–2019. A more detailed analysis was conducted for Greece. Empirical econometric estimates on NPLs using economic factors by country were conducted for the period 2000–2019, and the findings were compared to those of the recent relevant literature. Then, a combined evaluation of the economic findings based on cultural perspectives was attempted. Finally, as Greece remains the country with the highest percentage of NPLs over time in the EU, special emphasis was placed on estimating and interpreting the factors influencing NPLs in Greece.
The paper is structured as follows: First, there is a brief presentation of the evolution of NPLs in Europe, of the crisis evolution and of the measures taken to deal with it. Then, a presentation of the methodological approach (combination of economic factors and Hofstede’s Cultural Dimensions) and the data presentation follows. Accordingly, the findings are presented and compared to previous relevant literature findings and discussed in the light of a combined economic and cultural perspective. Finally, the main conclusions are summarized, placing special emphasis on Greece, and further research options are listed.
2. Literature Review
According to Stamatiou (2011), in the United States, up until 2005 there was a prolonged period of low interest rates and easing of credit criteria that led to an excessive increase in mortgage lending, both in the traditional and the mortgage sectors (sub-primes). Consequently, through the method of securitization of receivables, banks transferred the credit risk of the mortgage loans to other parts of the international financial system. In 2008, as a result of an economic decline, one of the largest US institutions, Lehman Brothers, collapsed, inducing global developments.
According to the BoG (2014b), the US financial crisis was transferred directly to financial institutions that were exposed to the derivatives of “Subprime loans”. Southern European countries, such as Portugal, Italy, Greece and Spain (the so-called PIGS), did not have much exposure and so did not initially view the crisis as a problem in their banking sector. However, the economic crisis quickly developed into a sovereign debt crisis and eventually into a liquidity crisis of the banking sector as a whole.
Concurrently, the ECB (2015) itself promoted quantitative easing (QE) policies, seeking to increase bond prices to create liquidity. In this case, through quantitative easing, the Central Bank purchased bonds from commercial banks, and thus provided the required liquidity to financial institutions.
The effects of the financial crisis have negatively affected the income of borrowers and consequently their ability to repay their loans. The result was an increase in the number of non-performing loans that the banking system had to manage. According to the Bank of Greece “Framework on the management by credit institutions of their non-performing exposures”, and the relative ECB (2017) Guidance, the concept of non-performing loans (NPLs) refers to loans that either the borrowers are late in repaying, or it has been estimated that they have very little chance or are even completely unlikely to be repaid. In banking practice, the category of non-performing loans includes loans that are not serviced for a constant period of 3 months or more (>90 days).
This recent financial crisis and the resulting financial hardship have led, among other things, to an increase in the percentage of non-performing loans and exposures. However, with the measures against the economic crisis taken by the European Union and its institutions, and by each member individually, it seems that the effects have clearly eased and—gradually from 2013 onwards—we are returning to normalcy. Based on the official data of the EU, as presented in the relevant Progress Report of the EC (2019), the percentages of NPLs at the European Union level, fell below 7.5% during the financial crisis in 2012–2013, and in the third quarter of 2018, fell to about 3.5%, i.e., to pre-crisis levels.
According to Louzis et al. (2012), economies in a phase of expansion are characterized by a relatively low number of NPLs, while, on the contrary, when they enter a phase of recession, NPLs increase. The effect of GDP on the ability to repay loans also becomes apparent.
Messai and Jouini (2013) analyzed the macroeconomic variables of NPLs for Greece, Spain and Italy, in a sample of 85 banks, for the period 2004–2008. They observed that the significant macroeconomic variables are the GDP growth rate, the unemployment rate and the real interest rate. In addition, non-macroeconomic variables, such as the return on assets (ROA), the change in loans terms and the ratio of loan losses, are also significant. The results of the survey showed that GDP growth has a negative impact on non-performing loans. On the contrary, the unemployment rate and the real interest rate have a positive effect on NPLs. The increase in the assets of credit institutions (non-macroeconomic factor) also has a negative impact. At the same time, banks need to consider both GDP growth and the competitiveness of the economy, as these affect borrowers’ ability to repay their debt. NPLs are also expected to have an upward trend in times of economic recession, as occurred during this research period.
However, Makri et al. (2014) highlighted the connection between the statuses of the economy of the Eurozone countries with the quality of the loan portfolio. They considered the NPLs as an endogenous variable that should be considered under both macroeconomic factors (public debt as percentage of GDP, budget deficit/surplus as a percentage of GDP, inflation, GDP and unemployment) and banking factors (loan-to-deposit ratio, bank capital plus reserves to total assets, ROE and ROA). The survey focused on the Eurozone countries for the period 2000–2008 and showed a significant correlation between the growth of the non-performing loans with unemployment, public debt and GDP. The aforementioned article had limited time observations, which were also acknowledged by its authors. In fact, they suggested another survey with more European countries and longer periods of observation.
Anastasiou et al. (2016) published their paper with a similar, but more extensive, scope. The causes of non-performing loans (NPLs) in Europe for the period 2003–2013 were examined using determinants related to credit risk measures, such as taxes and interest rate margins. The authors divided the Eurozone into two separate groups in order to avoid differences in NPL variables. The first group of countries was considered to be Central Europe (France, Germany, the Netherlands, Belgium, Austria, Finland, Lithuania, Slovakia and Luxembourg) and the other group included the “periphery” countries of the euro area region (Italy, Spain, Ireland, Greece and Portugal). In addition to the significant relationship between NPLs and macro-determinants identified by the authors, they also used quality management metrics, such as loan-to-deposit ratio, ROA, ROE and bank size. Using the fully modified OLS and Panel Cointegrated VAR methods, they concluded that unemployment, growth and taxes are the most important variables for both the central group and the countries in the periphery. Furthermore, the most important indicators of the periphery group were the interest rate and the size of the banks. The ROE, ROA and loan-to-deposit ratios seemed to affect only the central group of countries.
Due to the economic crisis, a question has arisen as to why some European countries face a greater problem of increasing non-performing loans, while others do not. What factors trigger the NPL phenomenon? Cerulli et al. (2017) examined for the period 2006–2016 a large sample of banks that were considered significant by the Single Supervisory Mechanism and studied the causation effect of the inefficiency of the judicial system, the economic growth and the benchmark rates on NPLs. The negative impact of economic growth on NPLs was confirmed, as expected. The authors also concluded that the level of judicial inefficiency is related to the level of NPLs in the following year. The more efficient the judicial system, the lower the increase in NPLs. The countries with the slowest judicial system in taking action against the debtors are Austria, Ireland, Cyprus and Greece (in contrast with Finland, Germany, France, Estonia and the Netherlands). The research showed that a one-month reduction in the average execution time of a contract positively affects NPLs by almost 0.24.
The macroeconomic and microeconomic determinants of non-performing loans were also the subject of Kosikova and Pastyrikova (2020). The NPL ratio was found that was affected by unemployment, GDP, capital adequacy, private debt ratio, net interest margin and exchange rate. The authors also concluded that the debt collection process will be negatively affected by a possible slowdown in economic recovery. Additionally, the state of the banking system seems to be shifting its problems to the real economy.
Political uncertainty, along with rising unemployment and the deterioration of the Greek economy, were examined by Charalambakis et al. (2017) as factors that contributed to the emergence of NPLs. They indicated a strong bond between political uncertainty and the economic downturn, as well as the negative correlation between political stability and the increase in NPLs. The banking variable returns on assets appear to determine NPLs, in contrast to changes in the equity and loan-to-deposit ratios that do not appear to affect NPLs.
On the other hand, since Hofstede developed his eponymous theory of national culture, the 6-Dimension Model of National Culture has been extensively used to understand the culture and temperamental characteristics of ethnic populations, related to the collective/common position in dealing with specific issues (i.e., Hofstede (2001); Hofstede et al. (2010)). A brief description of Hofstede’s 6-Dimension Model of National Culture as presented in Hofsted, according to his official website, is presented in Table 1.
The significance of national culture and especially the dimensions of pragmatism and indulgence/restraint in mortgage default were examined by Tajaddini and Gholipour (2017). The authors used Hofstede’s 6-Dimension Model of National Culture in order to examine the relationship between cultural criteria and default on mortgages, in 42 countries in Europe, Africa and America. Despite the limitations of not recognizing strategic or involuntary kinds of default, the authors concluded that the borrowers in countries with high individualism, regardless of the economic recession or stability, may default more on their mortgages, hence establishing the appropriateness of using Hofstede’s model for analyzing default on loans. However, the low level of realism (pragmatism) and the higher degree of indulgence criteria seem to have an impact on household loan mortgages only in a stable economic period. The indicators of power distance, masculinity/femininity and uncertainty avoidance seem to have a non-significant impact on non-performing household loans.
Chui et al. (2010) examined how cultural differences influence the profitability of investment strategies across international markets, also known as momentum strategies. They used the cultural index of 50 countries reported by Hofstede in 2001, which consists of the dimensions of individualism (IND), masculinity (MAS), power distance (PDI), and uncertainty avoidance (UAV), in order to examine the extent to which the momentum effect is generated by behavioral biases. They noticed that the cultural dimension of individualism is positively associated with trading volume and volatility, as well as to the magnitude of momentum profits. They concluded that individualism is likely to be correlated with overconfidence and attribution bias, and thus investors in less individualistic countries are insecure and tend not to follow investment practices that generate dynamic profits. On the other hand, the dimension of individualism is associated with a more aggressive investment behavior and willingness to take risks. At the corporate level, as investors interpret the information in different ways, and it is subject to different biases, the authors conclude that cultural dimensions influence stock dividend return policies, the company’s risk management procedures and the overall risk-taking tendency.
Laitinen and Suvas (2016) studied the data of thousands of non-failed and failed firms from 26 European countries in order to investigate the influence of Hofstede’s Cultural Dimensions on financial distress prediction, and in particular, the degree of impact of Hofstede’s theory on the comparability of financial distress prediction models in all European countries. In their paper, they combined the cultural dimensions power distance (PDI), individualism vs. collectivism (IDV), masculinity vs. femininity (MAS), and uncertainty avoidance (UAI) with several financial distress models that are used to give a warning of possible failure. The models are based on six predictors (return on assets (profitability), quick ratio (liquidity), equity ratio (solvency), standard deviation of ROAs (volatility), natural logarithm of total assets (size) and long-term growth of assets (GROW)). Evidence also shows that the effects of STDR (volatility) and long-term growth (GROW) are relatively similar, although those of volatility are less significant. However, its effect is moderated by all cultural dimensions, especially by PDI. The effects of growth and size are largely dependent on culture. The authors concluded that uncertainty avoidance (UAI) has a significant moderating effect on solvency; thus, the role of solvency becomes less important for countries with a low UAI score. The effect of profitability (return on assets) does not seem to be sensitive to cultural dimensions and circumstances. The effect of the traditional liquidity measure is strongly correlated with predictors of solvency. Thus, this measure is the second most effective predictor after solvency in countries with low UAI ratings. The impact of growth (long-term asset growth) does not play a significant role in predicting failure. It seems to be associated with low PDI, high IDV and low UAI. The abovementioned statement also holds for volatility (standard deviation of ROAs), whose effect in failure prediction often follows that of growth. The study also showed that the more traditional the failure model (based on traditional financial ratios, such as solvency, profitability and liquidity), the more effective the prediction is in different cultures. Finally, although the authors did not examine the cultural dimensions of long-term orientation vs. short-term orientation (LTO) and indulgence vs. restraint (IVR), they assumed that LTO moderates the effects of size, liquidity and volatility. On the other hand, IVR moderates the effects of size, volatility and solvency.
Ashraf et al. (2016) employed four cultural dimensions from Hofstede’s theory to an international sample of 1981 banks from 75 countries, during the pre-crisis period 2001–2007, to analyze the effects of culture on banking risk taking behavior. Specifically, their study relates the dimensions of uncertainty avoidance, individualism vs. collectivism, masculinity vs. femininity and power distance, with financial firms’ risk-taking behavior. They noticed that risk-taking is higher in countries with high individualism, low uncertainty avoidance and low power distance values. The masculinity dimension (MAS) seemed to have no effect. Furthermore, the authors generated a cumulative variable based on values of individualism (IND), uncertainty avoidance (UAI) and power distance (PDI), in order to identify which national cultures promote higher bank risk taking. The results of their models showed that higher values of cumulative national culture variables lead to higher bank risk taking. Following on from their findings, the authors suggest that multinational banks should always take into account the national cultural characteristics of the individuals of the country in which the subsidiary operates. The parent financial institution should consider the dimensions of national culture in order to have a proper understanding the risk-taking policies and procedures of their subsidiaries, as different cultural values lead to decisions that may differ geographically.
3. Methodology and Results
In this paper, an attempt was made to estimate the economic factors that influence the formation of NPLs in EU countries for the period 200–2019 and to assess whether their interpretation is consistent with Hofstede’s model. We proceeded by estimating the econometric model and evaluating the results we obtained against previous studies. Then, we presented the relevant Hofstede dimension indicators and conducted a combined evaluation. We proceeded by comparing the performance NPLs in countries of Southern Europe and Central Europe, and finally, we further explained Greece’s NPLs.
Eight EU countries were studied in two groups: (a) Southern Europe (namely, Portugal, Italy, Greece, Spain and Portugal) and (b) Central Europe (namely, Germany, France, Belgium and the Netherlands). Yearly data were used covering the period 2000–2019, thus allowing for an equal number of years (10 years) before and during the financial crisis and the associated NPLs/Total Loans ratios were estimated.
Following the relevant literature, the estimation of NPLs as a percentage of total gross loans as a dependent variable was attempted, using the following independent variables:
- Unemployment rate (UR), seasonally adjusted for the years 2000 to 2019. The variable was chosen as unemployment is directly related to the ability to service liabilities.
- Nominal unit labor cost (NULC), per unit of product (percentage change over a period of three years), calculated as the ratio of wage expenditure per employee to labor productivity, which is defined as the GDP per employee. This variable is identical to the changes in the average wage in the labor market. High labor costs mean high wages and, therefore, sufficient disposable income. On the contrary, negative changes in the index lead to a decrease in income and, therefore, a reduction in the ability to service liabilities.
- The consumer price index (CPI) reflects consumer price indices, as the average time change in prices paid by households for a specific basket of consumer goods and services, based on the year 2000. This index is of interest due to its correlation with disposable income. An increase in the index implies an increase in the cost of living and, therefore, a decrease in disposable income.
- Long-term cost of borrowing (LTCB) reflects the cost of borrowing indicator for long-term loans to both households and non-financial corporations. Increased borrowing costs mean complexity in serviceability.
- The loan-to-deposit ratio (LTDR), as an indicator that shows the long-term relationship between bank liabilities and bank receivables or, in other words, the relationship between borrowers’ cash and liabilities. The ratio of deposits to loans indicates, on the one hand, the amount of total cash/savings of the borrowers and, on the other hand, the size of the credit expansion of the banks.
- Annual growth rate (AGR), expressed as a percentage of annual change of GDP growth based on the year 2000. With this indicator, we examined the impact of economic development of the country, which as mentioned above is a determining factor in the occurrence of NPLs.
- The house prices variable (HP) reflects annual changes in house prices, based on the year 2000. This indicator examines the course of house prices as a factor that affects the changes in NPLs. In particular, a sharp drop in prices may lead to an increase in non-performing loans, as it is expected to cause borrowers to be reluctant to repay a loan with a higher face value than the current market value of the home.
- Overall inflation (OI), based on the year 2000, as a factor that shapes prices through supply and demand.
- Government debt-to-GDP ratio (GD), based on the year 2000. This indicator is the main meter of the strength of a state, as it reflects the ability to repay government debt by own means.
- Taxes on goods and services (%) of revenue (TAX). The above index shows the percentage of impairment of the average gross income due to the imposed taxes. In addition to labor taxes, other property taxes are included.
- Other taxes (%) of revenue (OT). These include value added tax, selective excise duty, and selective tax on services and on the use of goods or real estate. In essence, any additional tax reduces disposable income and, therefore, the ability to repay loans.
Yearly data for the period 2000–2019 were used, and separate estimations for each country were performed. The key statistics of the variables used are presented in Table 2 below (relevant data were derived from Eurostat, World Bank and Bank of Greece).
The model estimated was as follows:
NPLs = βο + β1*UR + β2*NULC + β3*CPI + β4*LTCB + β5*LTDR + β6*AGR + β7*HP + β8*OI + β9*GD + β10*TAX + β11*OT
During the econometric processing of the data, the following factors were taken into account and examined:
- ✓
- Correlation test: Separately, for each country, the normality of the data was examined through the Kolmogorov–Smirnov test. The data of all countries were found to follow normal distribution (p> 0.05) and, therefore, the Pearson coefficient was used to examine the negative and positive correlations between NPLs and the other independent variables of each country.
- ✓
- Heteroscedasticity test: In all countries, the price distribution was checked. Based on the distribution of data, there does not appear to be any heteroscedasticity. The White test was performed to check the heteroscedasticity.
- ✓
- Autocorrelation test: The values obtained by the price fluctuation through the R and R2 indicators in the regression model for each state were checked. Values indicate a high degree of correlation between the dependent variable (NPLs) and the independent variables. The high values of the adjusted R square and R2 also indicate that the regression model matches the data. The Durbin–Watson test was performed to check the autocorrelation of the residuals.
- ✓
- Multicollinearity test: The values of the swelling coefficient (VIF—variance inflation factor) were used to check the multilinearity. In combination with the tolerance index, it was found that there is no question of multilinearity nor a possible correlation.
- ✓
- OLS: Following the tests above, the ordinary least squares method (OLS) was used, taking into account the independent variables, which are statistically significant and affect the dependent variable of each country.
Finally, statistically significant variable bias problems were eliminated. The results show no heteroscedasticity autocorrelation or multicollinearity.
Table 3 shows the statistically significant variables (significance <0.05) of each country for the econometric estimations performed for each country after performing the necessary heteroscedasticity, autocorrelation, and multicollinearity tests.
The main findings can be summarized as follows:
- The loan-to-deposit ratio, as a banking factor and quality management metric, has statistical significance in 2 out of 4 countries in Southern (Greece and Italy) and in 2 out of 4 countries in Central Europe (Netherlands and Belgium), but displays a different effect. Specifically, in the central countries, there is a negative impact of the loan-to-deposit ratio to NPLs. We consider this fact to be related both to the differences in the savings mentality of the member states and that the credit expansion in these states is not accompanied by an increase in NPLS, suggesting stricter credit scoring and more effective credit risk management. The importance of this indicator (LTD) has also been highlighted by Cerulli et al. (2017).
- The annual growth rate and house prices in Greece have a significant positive and negative effect, respectively. These indicators do not seem to have an impact on other countries, which was not expected, as their importance was highlighted by most of the aforementioned studies. The importance of the annual growth rate from Messai and Jouini (2013) was particularly emphasized, as well as from Makri et al. (2014), Anastasiou et al. (2016), Cerulli et al. (2017), and finally Kosikova and Pastyrikova (2020). The importance of the house prices index has been highlighted by Tajaddini and Gholipour (2017).
- The government debt ratio is statistically significant in 2 of the 4 countries of Southern (Greece and Italy) as well as in 2 of the 4 countries of Central Europe (Germany and Belgium), with a positive effect on the NPLs of these states agreeing with the aforementioned study of Makri et al. (2014) and confirming the connection between the economy and the quality of the loan portfolio.
- Regarding the consumer price indices, the paradox of their negative effect on the NPLs of Greece and France was observed. In particular, the opposite effect was expected, i.e., that an increase (or decrease) in prices would lead to an increase (or decrease) in NPLs, given that an increase in consumer prices directly leads to an increase in the cost of living and thus reduces disposable income.
- For the other variables, it is worth mentioning the unemployment rate, which seems to have no significant impact on Greece but a positive impact on two of the other southern countries (Spain and Italy) and in 1 of the 4 central countries (France). This fact was not expected, taking into account the above studies (with the exception of Cerulli et al. (2017)) that record the great importance attached to this variable, as an indicator of economic growth.
- Finally, an unexpected result was the insignificance of the variables nominal unit labor cost and taxes on goods—services of revenue. Although they were not examined by other surveys (except for taxes examined by Anastasiou et al. (2016)), we expected that these factors would be important, at least for Greece, as during the crisis, there was a large decrease in wages and at the same time an increase in direct and indirect taxes. The above may be explained on the basis of the savings culture of the Greeks who resorted to their savings using their cash to meet needs. On the contrary, it seems that both variables were important for France, while Belgium’s NPLs were considerably affected only by the nominal unit labor cost. It is worth noting that in France, changes in labor cost have a positive effect on NPLs, which was not expected.
Portugal is not mentioned in Table 3, as no statistically significant estimates were obtained for the model variables. This is consistent with the OECD (2019) findings that the significant liquidity crisis experienced by the country seems to have played a major role in increasing Portugal’s NPLs. Part of the problem was the financing structure of the banking sector, which consisted largely of securities and the interbank market, the bankruptcy code that made it difficult for banks, the long-standing inability of the Portuguese financial system to approach credit risk and creditworthiness, as well as the effects of mismatching between borrower profiles and interest rate margins.
The unusually high R2 could be attributed to the estimation of separate country-specific time series that could be remedied by panel data estimates and/or to the need for sample data covering a longer period of time (e.g., 15 years) that maybe feasible in the future.
The indicators of the countries studied based on Hofstede’s 6-Dimension Model of National Culture are illustrated in Figure 2 below. As mentioned in the database, the initial scores for all countries were estimated in 2001 and were updated in 2015. According to Zhao et al. (2016), the time required to safely update Hofstede’s dimensions is 40 years, with the possible exception of the individualism dimension, which seems to be 20 years. Therefore, the figures are considered representative of the period under study.
The main findings of Figure 2 can be summarized as follows:
- 1.
- Power Distance—PDΙ
The PIGS countries—Greece, Italy, Portugal and Spain—with scores of 60, 50, 63 and 57, respectively, respect the hierarchy and recognize the existence of social inequalities. Belgium and France have similar characteristics with scores of 65 and 68, respectively, as opposed to Germany and the Netherlands (scores of 35 and 38, respectively), which seem to encourage more of a decentralized power structure.
- 2.
- Individualism/Collectivism—IDV
Greece, Portugal and Spain with scores of 35, 27 and 51, respectively, are considered collectivist, while, on the contrary, Italy, with a score of 76 has an individualistic culture. The same is the case for Belgium, France, Germany and the Netherlands, which have scores of 75, 71, 67 and 80, respectively.
- 3.
- Masculinity vs. Femininity—MAS
The scores of Greece, Italy, Portugal and Spain (57, 70, 31 and 42, respectively) indicate that, even marginally, Greece and Italy, are “Male” societies. In contrast, Portugal and Spain are “female” countries, where equality, solidarity and quality in professional and social life are the most valued. France (43) and especially the Netherlands (14), which is famous for its welfare state, have feminine characteristics, while Belgium (54) and Germany (66) have marginally masculine characteristics.
- 4.
- Uncertainty Avoidance—UAI
The scores of Greece, Italy, Portugal and Spain are 100, 75, 99 and 86, respectively, indicating the emphasis on the existence of rules and bureaucracy and the fear of uncertainty. As for the “northern” countries, the abovementioned characteristics are most pronounced in Belgium (score 94) and France (core 86). In contrast, Germany and the Netherlands (with scores of 65 and 53, respectively) are more neutral in their existence of uncertainty.
- 5.
- Long-term orientation vs. Short-term orientation—LTO
Of the eight countries in the sample, only Greece, Portugal and Spain can be characterized as not having a long-term orientation with scores of 45, 28 and 48, respectively. They are highly respected for their traditions and focus on achieving fast results. In contrast, the rest of the countries (all with a score above 60) have a long-term orientation, and their society is realistic.
- 6.
- Indulgence vs. restraint—IVR
Greece presents an intermediate score of 50 in this criterion, so the clear preference or differentiation between indulgence and restraint cannot be proven; therefore, the momentum in one direction or another probably depends on other situations and social factors. Belgium (57) and the Netherlands (68) have the highest score, which is above average. They appear to be more optimistic, and in addition, they assign more importance to their free time; they act based on their personal “want” and spend their money as they wish. Below average are Spain (44), Italy (30), Portugal (33), France (48) and Germany (40), which indicates that they are more or less moderate societies, with tendencies towards realism and pessimism.
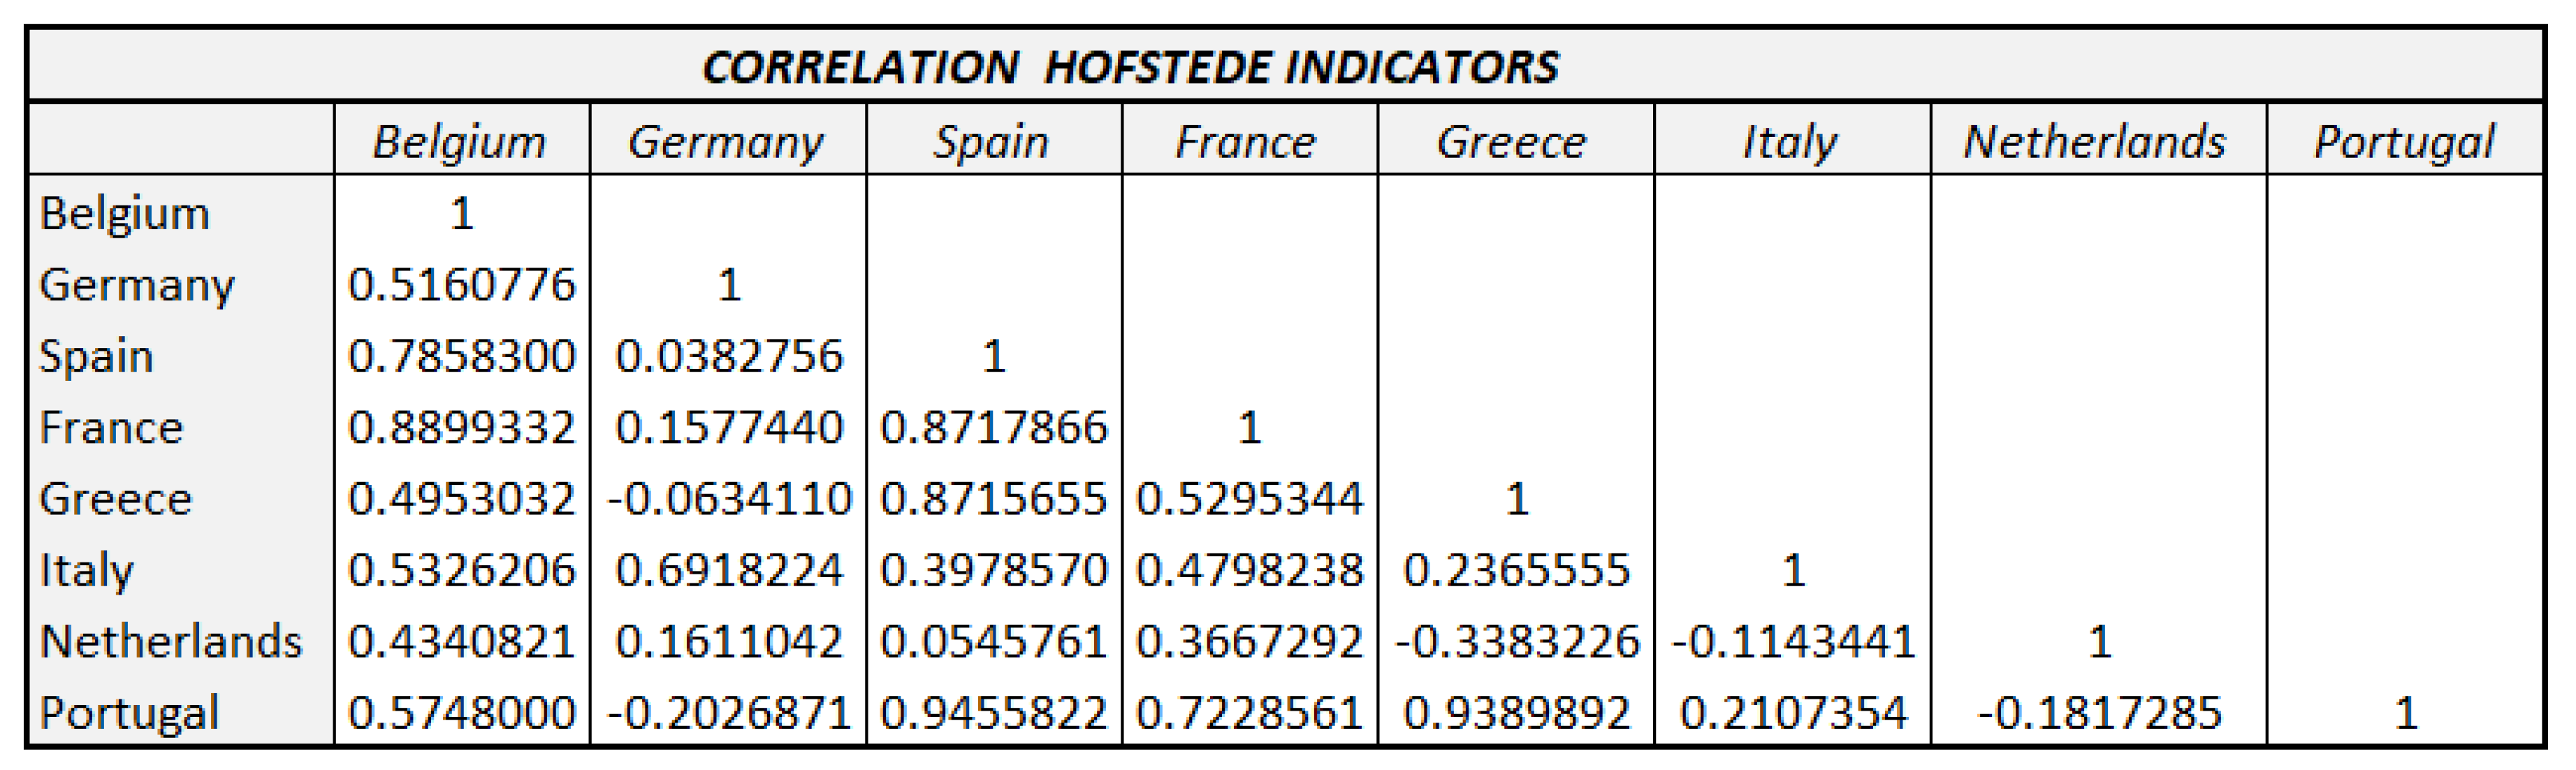
A linear correlation test of the Hofstede country scores was performed, presented in Table 4 below, which showed the exceptionally strong correlation (more than 0.93) of Southern Europe, especially among Greece, Spain and Portugal; this indicates that their populations have many characteristics in common both in their mentality and, consequently, in dealing with various situations. The aforementioned countries show little or no correlation with the countries in Central EU, with the exception of France, which has above-average values (0.50) compared to almost all of the Southern European countries studied, except Italy. Central EU countries show few similarities among them, which shows that they are contained by different cultures, despite their territorial proximity and the similarities of their economies.
Furthermore, Table 4, regarding NPLs, implies the following:
- a.
- Southern Europe
The common culture of the people of the south, as shown in Table 4, seems to explain the problem of NPLs in these countries, in addition to the purely economic factors arising from the regression. In particular, based on the strong correlation of the Hofstede criteria among Greece, Spain and Portugal, the increase in and any maintenance of high levels of NPLs in these countries can be explained in a similar way to Greece. Both Spain and Portugal can be characterized as more “collectivist” societies (IDV index), with “feminine” characteristics (mas index), who believe in the power of the hierarchy (PDI index), prefer sociability and fun (UAI index) over short-term targeting (LTO index), and finally, are tolerant of pleasure-related phenomena (IVR index). Although the performance of Spain and Portugal in the issue of NPLs is much better than the performance of Greece, the abovementioned common characteristics of societies can be used to explain the large increase in non-performing loans during the crisis. In contrast to Greece (which has not yet managed to return to pre-crisis levels), the increase in NPLs in all three countries can be argued to be due, in part, to the particular temperamental characteristics of their people, in addition to the economic conditions. Especially for Italy (in particular, the north of Italy), its differentiation from the other countries of Southern Europe is emphasized, as individualism prevails over collectivism (IDV index value: 76); it is more a “masculine” than a “female” society (index value mas: 70); it is not very tolerant of the hierarchy, similar to the rest (PDI index: 50); and, finally, it has a long-term orientation (LTO index value: 61). The above data may explain why Italy acted decisively and recovered quickly from the NPL problem. In the ten-year financial crisis that affected its banking system and increased non-performing loans from 6.30% in 2008 to 16.50% in 2015, Italy seemed more determined to tackle the problem. As a masculine society, it tends to prefer the decentralization of power to rapid and targeted decision making. Therefore, it acted quickly, recapitulated troubled banks and tackled “red” loans. For this reason, at the end of 2019, it presented a percentage of NPLs at pre-crisis levels (6.70%).
- b.
- Central Europe
Out of the countries in the European “center”, France is worth mentioning, even if it did not have a particular problem with NPLs as with the rest of the Southern Europe. France has many common social characteristics with Greece, Spain and Portugal (and less so with Italy). In particular, it possesses feminine characteristics (MAS index: 43) and a rather long-term targeting (LTO index: 63), it is characterized as an “individualistic” society (IDV index: 71), it is hierarchically structured (PDI index: 68), it is particularly prone to fun and socializing (UAI index: 86), and finally its tolerance of pleasure-related phenomena is limited (IVR index: 48). Correspondingly, the biggest differences between the countries of the south and the countries of Belgium, Germany and the Netherlands are that the latter show a high degree of “individualism” (IDV index); therefore, they assign more importance to personal achievements and the protection of individual rights. The value of personal responsibility is high, while the protection of individuals is not left to the state alone, as every citizen feels that he has the right to defend themselves and their social achievements. At the same time, unlike the south, these countries are more forward-looking, with a long-term target (LTO index). We consider these characteristics to have had a deterrent effect on these countries, to the extent that the economic crisis has not had the same impact on them as the countries of the south.
The findings for Greece are herein further analytically assessed due to the fact that although the problem of NPLs has taken on global proportions, it seems that in Greece, it has had an even larger effect. While the rest of European countries have managed to alleviate the problem of NPLs, the Greek banking system, so far, has not been able to show the corresponding improvement. Despite the stabilization of the Greek economy, the problem remained almost unchanged for many years, as, in addition to the economic dimension in the emergence of NPLs, banks have to deal with the social dimension of the problem.
The econometric estimation for Greece showed the statistically significant economic coefficients affecting the NPL formation: consumer price index, loan-to-deposit ratio, annual growth rate, house prices and government debt ratio. These results, coupled to the sociocultural characteristics of Greek society as measured by Hofstede’s Cultural Dimensions, could be assessed as follows:
- Individualism—IDV: The collectivist character of Greek society (score 35) was applied to the consumer price indices, the increase in which affected the disposable income resulting in the increase in NPLs. The extended family took care of its members affected by the crisis, in exchange for their trust and devotion.
- Power distance—PDI: High rates of NPLs in Greece can be justified by the high score in this criterion. The Greek state, which was responsible for the crisis, took responsibility for its failure, which appears in the government debt ratio (%) and annual growth rate.
- Masculinity—MAS: This criterion does not seem to be directly applicable to any of the statistically significant determinants of NPLs.
- Uncertainty Avoidance—UAI: Greece, with a score of 100, is absolute in trying to avoid uncertainty. We consider that it applies to the economic criterion loan-to-deposit ratio, which is an indication of a decrease in deposits with banks. In addition, a high government debt ratio and low economic performance (annual growth rate and house prices) indicate a two-way lack of trust between the government and citizens.
- Long-Term Orientation—LTO: The long-term poor performance of the economy and growth (government debt ratio, annual growth rate and house prices) shows that Greece does not have long-term orientation. The low score (45) in the corresponding Hofstede criterion is, therefore, verified.
- Indulgence—IVR: This criterion does not seem to be directly applicable to any of the statistically significant determinants of NPLs.
Based on Greece’s score in Hofstede’s 6-Dimension Model of National Culture, the high percentages of NPLs in the Greek banking system could be briefly explained as follows:
- Greece, based on the rating of individualism/collectivism (IDV) and power distance (PDI), shows a “collectivist” culture. This means rewarding strong bonds of social groups, such as family and friends, who always tend to protect their members. There is also a tendency to respect both hierarchical structures and the acceptance of social inequalities.
- Combined with the high value of “masculinity” versus “femininity” (MAS), the importance of individual success or failure that directly affects the status of the individual’s social group is highlighted. Thus, it is considered normal for someone with non-performing loans to seek and receive protection either from their relatives or from the state that has shown a willingness to protect borrowers and victims of the crisis (e.g., laws on the suspension of auctions, “Katseli’s Law” for the protection of borrowers and new bankruptcy law).
- At the same time, the value of the indulgence versus restraint index (IVR) represents the exact average of the scale, so we can understand that the Greek society appears to be, depending on the circumstances, either tolerant or strict in cases of non-compliance with loan obligations. In the case of Greece, the prevailing view is that the crisis stemmed from the failure of state choices, thus justifying any individual responsibility of the borrowers, further exacerbating the problem.
- The above, in combination with the high value of the uncertainty index (UAI), suggests that the Greek population does not like the uncertainty of NPLs. However, they prefer to invest time and money in fun and socializing, rather than in the service of their obligations, as they are expressive and enthusiastic. They have a relatively short-term orientation and a short-sighted perspective, which is also proven by the values received by the long-term orientation vs. short-term orientation index (LTO).
4. Conclusions
In the present paper, an analysis was performed in order to evaluate whether the combination of the economic and socio-cultural perspectives (as reflected by Hofstede’s 6-Dimension Model of National Culture) could provide a more thorough interpretation of NPL development in the EU. Eight EU countries were studied in two groups: (a) Southern Europe (four countries, including Greece) and (b) Central Europe (four countries) for the period 2000–2019. A more detailed analysis was conducted for Greece. The findings support the argument that the combined framework of econometric estimates of sociocultural characteristics could provide a more holistic approach to interpretating NPL formation. Still certain limitations are present. Although the econometric findings were consistent with those of previous studies, the model’s robustness needs further testing. The use of panel data instead of separate time series estimated per country would remedy the unusually high R2, and the use of data covering a longer period of time (e.g., 15 years) would further improve the estimates.
Further research could include the introduction of bank-specific variables (including risk, capitalization, bank-size and variables related to management efficiency) or variables related to the jurisdictional efficiency of the legal framework for NPL management, could be considered.
Furthermore, the methodology could be applied for comparing NPL estimates of (a) Euro-zone countries to the rest of the EU countries and (b) EU countries that had memorandums to the rest of the EU countries that did not.
Finally, as noted in the Bank of Greece Governor’s Act 2589/20 August 2007, the concept of non-performing exposure (NPE), is much broader and includes everything, inside and outside the balance sheet, “which either creates or may create a claim on the credit institution”. In addition, non-performing exposures include those that, based on specific criteria, have been classified as doubtful collection, regardless of whether they have not yet fallen into debt and are still being serviced, as further explained by the BoG (2014a) and the ECB (2015). Therefore, further research could be focused on examining NPEs instead of NPLs.
References
- Anastasiou, D.; Louri, H.; Tsionas, M. Non-Performing Loans in the Euro Area: Are Core-Periphery Banking Markets Fragmented? Bank of Greece, Economic Analysis and Research Department – Special Studies Division., 2016.
- Ashraf, B. N.; Zheng, C.; Arshad, S. Effects of national culture on bank risk-taking behavior. Research in International Business and Finance 2016, 37, 309–326. [Google Scholar] [CrossRef]
- Bank of Greece. Framework on the management by credit institutions of their non-performing exposures. 2014a. https://www.bankofgreece.gr/en/main-tasks/supervision/issues-of-non-performing-exposures.
- Bank of Greece. The Eurosystem Takes New Action to Support Financial Stability: 2010–2013, The chronicle of the great Crisis 2008–2013; Center of Culture Research and Documentation: Athens, Greece, 2014b; pp. 73–78. [Google Scholar]
- Cerulli, G.; D’Apice, V.; Fiordelisi, F.; Masala, F. Non-Performing Loans in Europe: The Role of Systematic and Idiosyncratic Factors. Banking Review Policy Journal 2017, 3, 34–59. [Google Scholar]
- Charalambakis, E.; Dendramis, Y.; Tzavalis, E. On the Determinants of NPLs: Lessons from Greece; (Working Paper); Bank of Greece: Athens, Greece, 2017. [Google Scholar]
- Chui, A. C. W.; Titman, S.; Wei, K. C. J. Individualism and Momentum around the World. The Journal of Finance 2010, 65(1), 361–392. [Google Scholar] [CrossRef]
- European Central Bank. Banking Supervision. 2015. https://www.bankingsupervision.europa.eu/banking/priorities/npl/html/index.en.html.
- European Central Bank. Guidance to banks on non-performing loans. March 2017. https://www.bankingsupervision.europa.eu/ecb/pub/pdf/guidance_on_npl.en.pdf.
- European Commission. Fourth Progress Report on the reduction of non-performing loans and further risk reduction in the Banking Union, European Commission, 2019.
- Hofstede, G. Culture’s Consequences: Comparing Values, Behaviors, Institutions, and Organizations Across Nations, 2nd ed.; Sage Publications: Thousand Oaks CA, 2001. [Google Scholar]
- Hofstede, G.; Hofstede, G. J.; Minkov, M. Cultures and Organizations: Software of the Mind, 3rd ed.; McGraw-Hill: New York, NY, 2010. [Google Scholar]
- Kosikova, K.; Pastyrikova, M. Determinants of Non-Performing Loans in European Union Countries. In Proceedings of the 13th Economics & Finance Virtual Conference, Prague, Czech Republic, 23 June; 2020. [Google Scholar]
- Laitinen, E. K.; Suvas, A. Financial distress prediction in an international context: Moderating effects of Hofstede’s original cultural dimensions, University of Vaasa, Faculty of Business Studies, Unit of Accounting & Finance, 2016.
- Louzis, D. P.; Vouldis, A. T.; Metaxas, V. L. Macroeconomic and bank-specific determinants of non-performing loans in Greece: A comparative study of mortgage, business and consumer loan portfolios. Journal of Banking and Finance 2012, 36, 1012–1027. [Google Scholar] [CrossRef]
- Makri, V.; Tsagnanos, A.; Bellas, A. Determinants of Non-Performing Loans: The Case of Eurozone. Panoeconomicus 2014, 2, 193–206. [Google Scholar] [CrossRef]
- Messai, A.; Jouini, F. Micro and Macro Determinants of Non-performing Loans. International Journal of Economics and Financial Issues 2013, 3, 852–860. [Google Scholar]
- OECD. Economic Surveys. 2019, pp. 32–39. https://www.oecd.org/economy/surveys/Portugal-2019-economic-survey-overview.pdf.
- Stamatiou, T. The Role of CDS in the 2008 USA Crisis and in the 2010 Greek Financial Crisis, The International Crisis, the Eurozone Crisis and the Greek Financial System; Hellenic Bank Association: Athens, Greece, 2011; pp. 139–164. [Google Scholar]
- Tajaddini, R.; Gholipour, H. National Culture and Default on Mortgages. International Review of Finance 2017, 17(1), 107–133. [Google Scholar] [CrossRef]
- Zhao, H.; Kwon, J.; Yang, O. Updating Hofstede’s Cultural Model and Tracking Changes in Cultural Indices. Journal of International Trade & Commerce 2016, 12, 85–106. [Google Scholar]
Figure 1.
NPLs to total gross loans (%) 2000–2019: Greece, Spain, Italy, Portugal, Germany, France Netherlands, and Belgium. Source: Own calculations based on World Bank, Eurostat and Bank of Greece data.
Figure 1.
NPLs to total gross loans (%) 2000–2019: Greece, Spain, Italy, Portugal, Germany, France Netherlands, and Belgium. Source: Own calculations based on World Bank, Eurostat and Bank of Greece data.
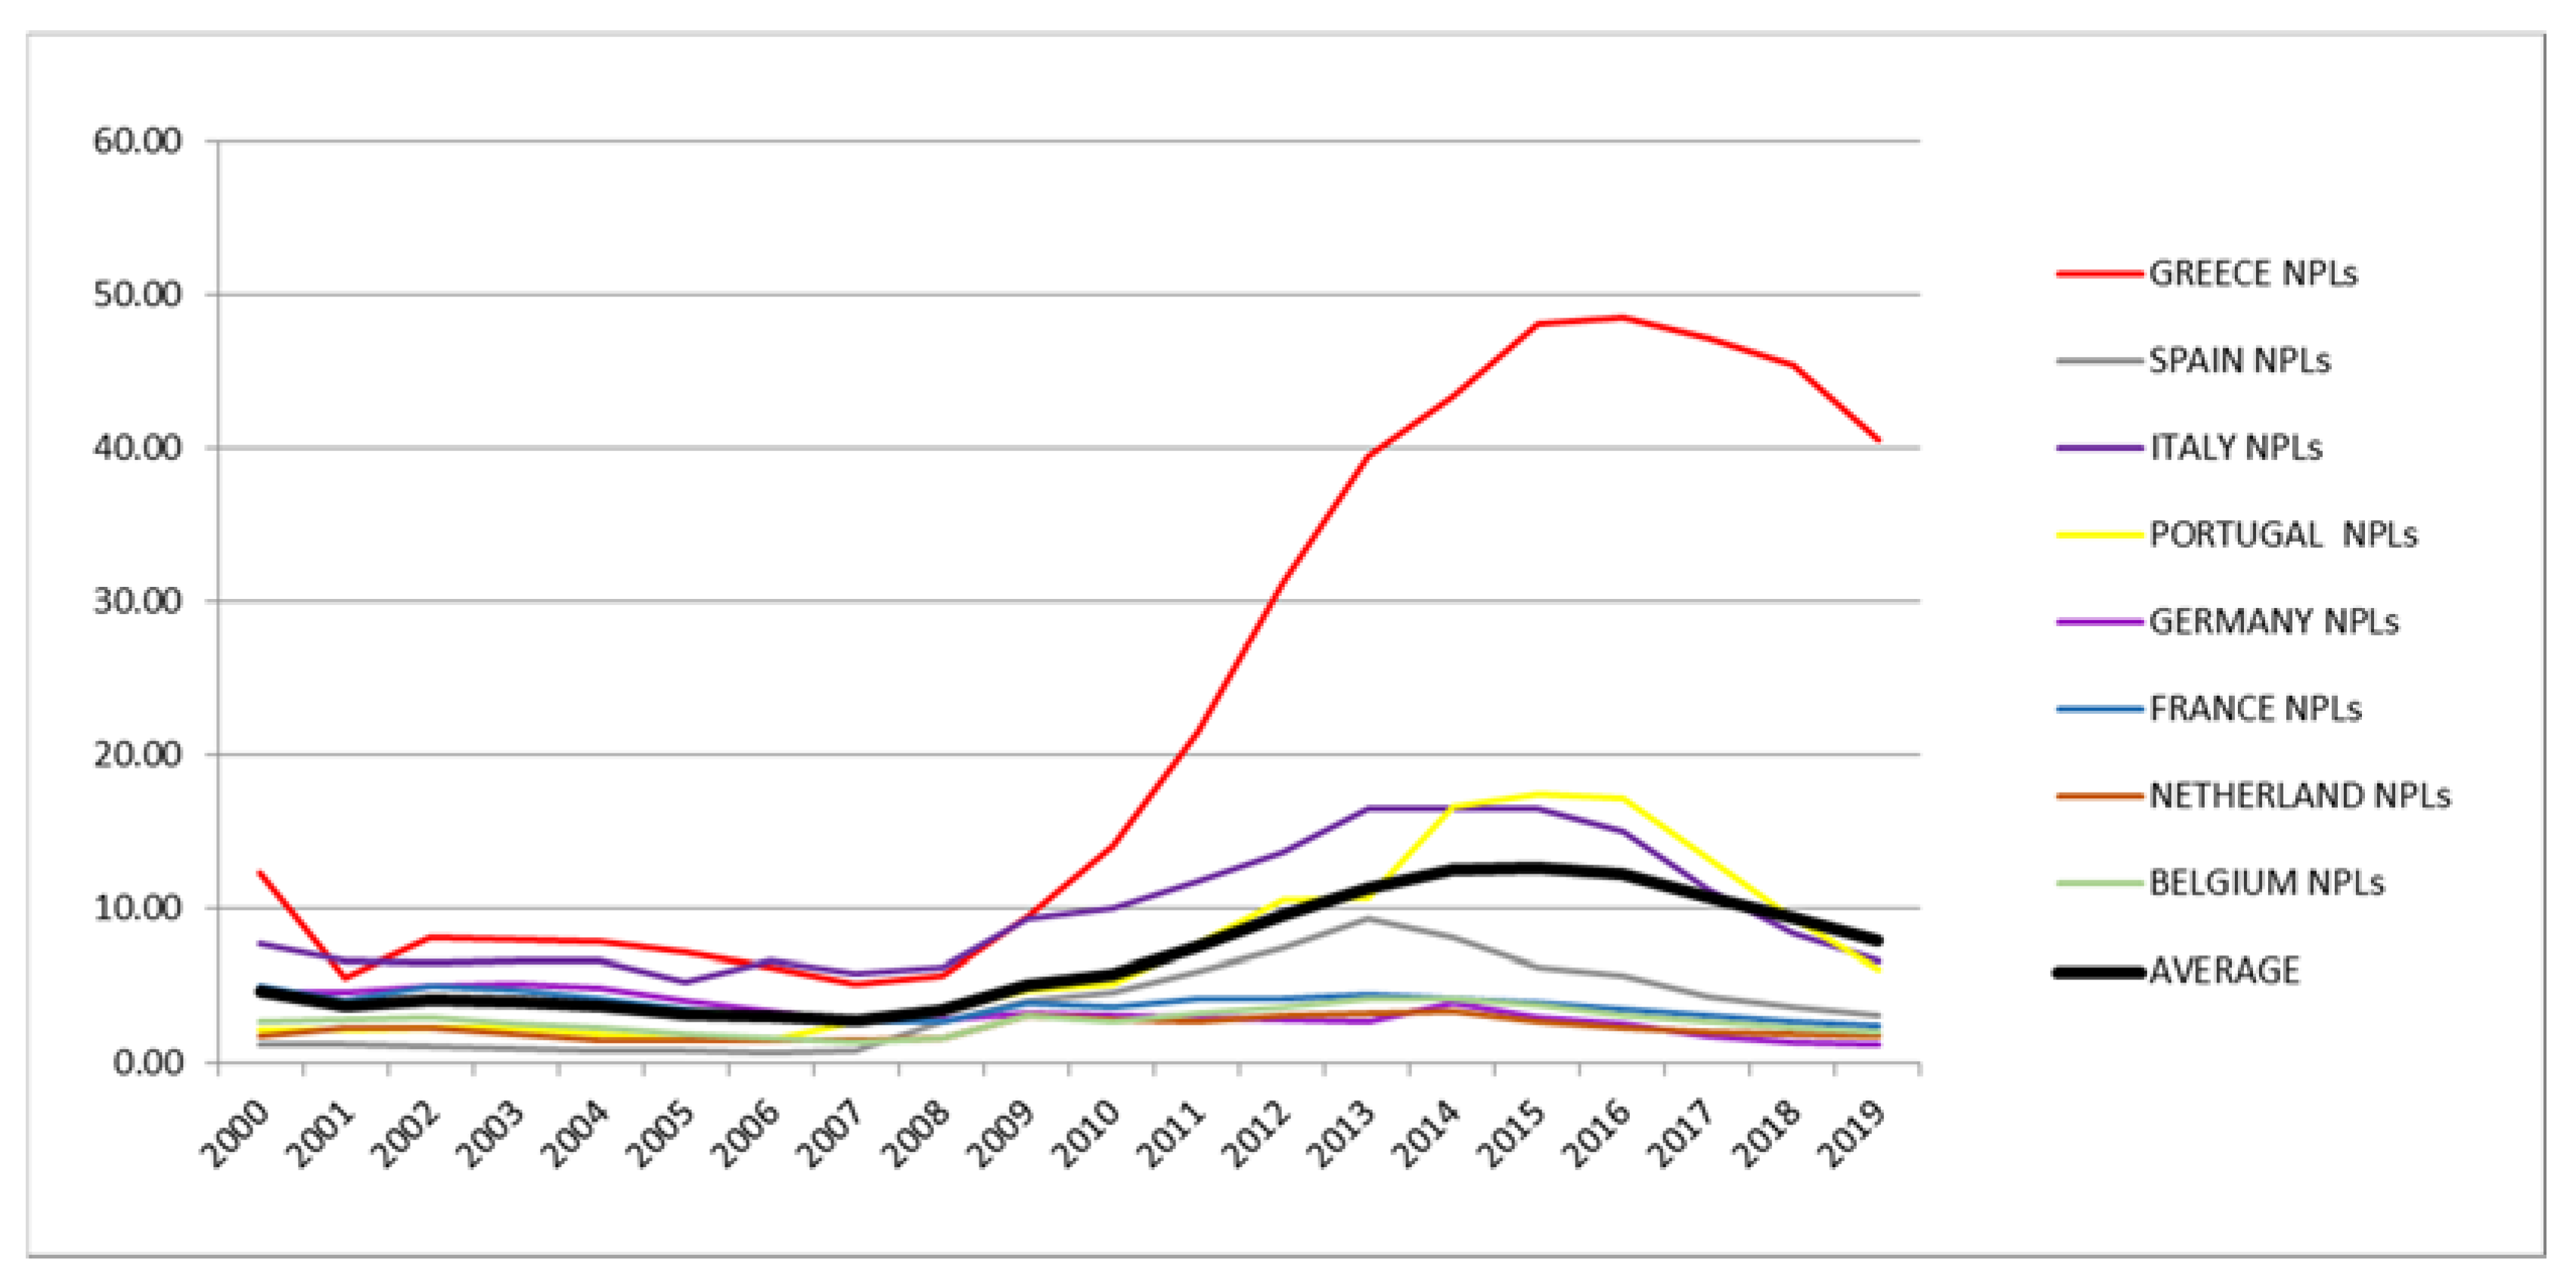
Figure 2.
Hofstede’s 6-Dimension Model of National Culture country scores. Source: www.hostede-insights.com.
Figure 2.
Hofstede’s 6-Dimension Model of National Culture country scores. Source: www.hostede-insights.com.
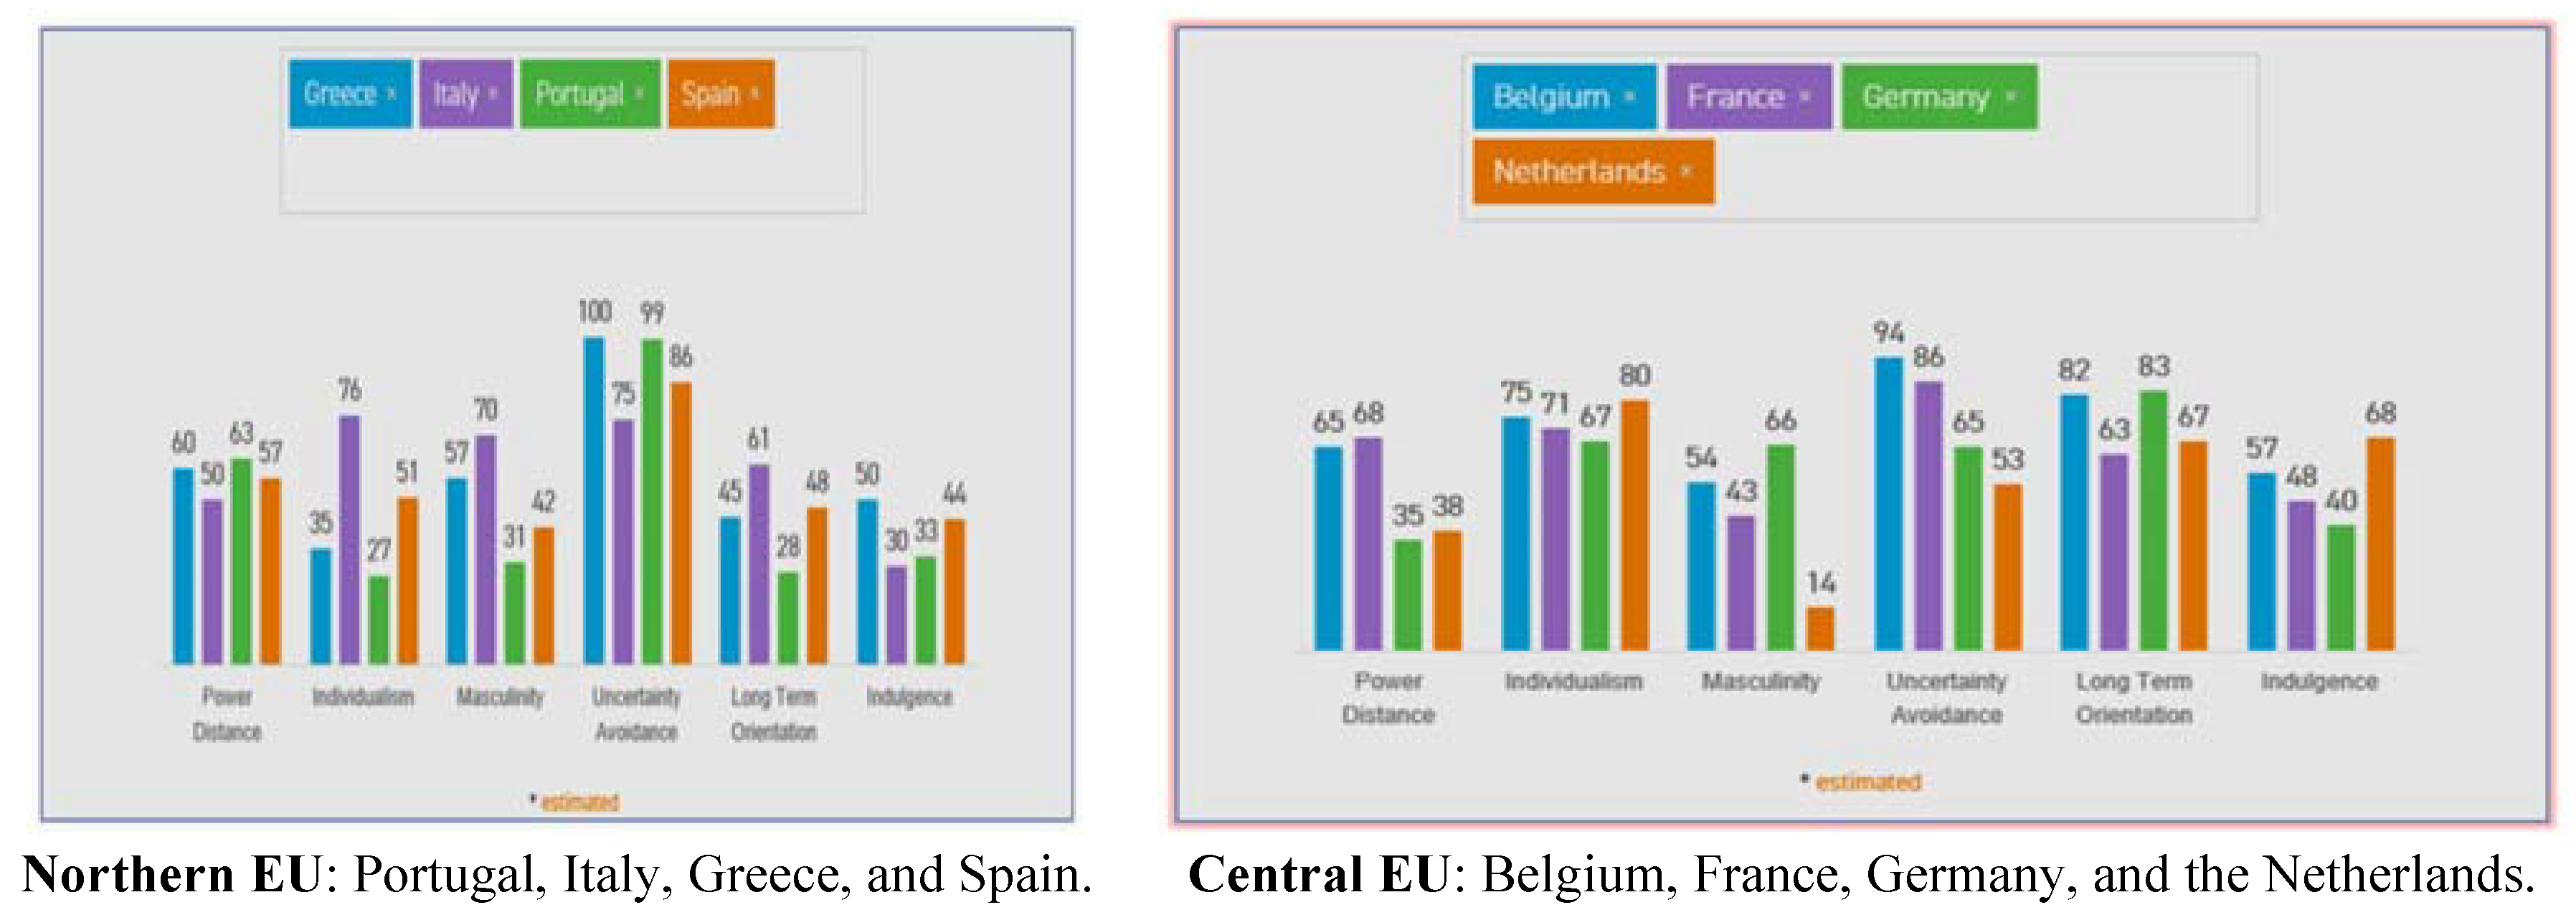

Table 1.
Hofstede 6-Dimension Model of National Culture. Source: The 6-Dimension Model of National Culture by Geert Hofstede (www.geerthofstede.com).
Table 1.
Hofstede 6-Dimension Model of National Culture. Source: The 6-Dimension Model of National Culture by Geert Hofstede (www.geerthofstede.com).
| Individualism/Collectivism—IDV | “Individualism is the extent to which people feel independent, as opposed to being interdependent as members of larger wholes. Individualism does not mean egoism. It means that individual choices and decisions are expected. Collectivism does not mean closeness. It means that one “knows one’s place” in life, which is determined socially. With a metaphor from physics, people in an individualistic society are more like atoms flying around in a gas while those in collectivist societies are more like atoms fixed in a crystal” |
| Power Distance—PDI | “Power Distance is the extent to which the less powerful members of organizations and institutions (like the family) accept and expect that power is distributed unequally. This dimension is thought to date from the advent of agriculture, and with it, of large-scale societies. Until that time, a person would know their group members and leaders personally. This is not possible where tens of thousands and more have to coordinate their lives. Without acceptance of leadership by powerful entities, none of today’s societies could run”. |
| Uncertainty Avoidance—UAI | “Uncertainty avoidance deals with a society’s tolerance for uncertainty and ambiguity. Uncertainty avoidance has nothing to do with risk avoidance, nor with following rules. It has to do with anxiety and distrust in the face of the unknown, and conversely, with a wish to have fixed habits and rituals, and to know the truth.” |
| Masculinity vs. Femininity—MAS: | “Masculinity is the extent to which the use of force in endorsed socially. In a masculine society, men are supposed to be tough. Men are supposed to be from Mars, women from Venus. Winning is important for both genders. Quantity is important and big is beautiful. In a feminine society, the genders are emotionally closer. Competing is not so openly endorsed, and there is sympathy for the underdog. This is NOT about individuals, but about expected emotional gender roles. Masculine societies are much more openly gendered than feminine societies.” |
| Long-Term Orientation vs. Short-Term Orientation—LTO | “Long-term orientation deals with change. In a long-time-oriented culture, the basic notion about the world is that it is in flux and preparing for the future is always needed. In a short-time-oriented culture, the world is essentially as it was created, so that the past provides a moral compass, and adhering to it is morally good. As you can imagine, this dimension predicts life philosophies, religiosity, and educational achievement.” |
| Indulgence vs. Restraint—IVR | “Indulgence is about the good things in life. In an indulgent culture it is good to be free. Doing what your impulses want you to do, is good. Friends are important and life makes sense. In a restrained culture, the feeling is that life is hard, and duty, not freedom, is the normal state of being.” |
Table 2.
Key Statistics. Source: Sample statistics based on World Bank, Eurostat and Bank of Greece data.
Table 2.
Key Statistics. Source: Sample statistics based on World Bank, Eurostat and Bank of Greece data.
| NPLs % Total Gross Loans | Unemployment Rate | Nominal Unit Labour Cost | Consumer Price Indices | Long Term Cost of Borrowing | Loan to Deposit Ratio | Annual Growth Rate | House Prices | Overall Inflation | Government Debt Ratio | Taxes on Goods and Services of Revenue | Other Taxes of Revenue | ||
|---|---|---|---|---|---|---|---|---|---|---|---|---|---|
| GREECE | Average | 22.768 | 15.777 | 5.360 | 100.099 | 4.663 | 95.064 | 0.321 | −0.405 | 1.950 | 139.677 | 31.445 | 3.029 |
| Min | 5.218 | 7.980 | −10.390 | 89.992 | 2.900 | 56.372 | −10.116 | −12.100 | −2.500 | 101.456 | 30.011 | 1.676 | |
| Max | 48.534 | 27.470 | 15.800 | 108.823 | 6.670 | 141.521 | 6.776 | 11.300 | 5.200 | 182.543 | 33.293 | 4.629 | |
| Std Dev | 17.233 | 6.769 | 8.653 | 5.204 | 0.819 | 24.902 | 4.337 | 6.497 | 1.929 | 33.717 | 0.989 | 1.153 | |
| PORTUGAL | Average | 6.975 | 9.786 | 4.245 | 102.567 | 4.315 | 134.419 | 0.867 | 0.600 | 1.835 | 92.884 | 32.106 | 2.811 |
| Min | 1.500 | 4.830 | −6.225 | 96.585 | 1.510 | 90.226 | −4.528 | −8.800 | −0.300 | 50.317 | 29.042 | 2.438 | |
| Max | 17.500 | 17.280 | 11.912 | 107.218 | 6.340 | 166.626 | 3.865 | 9.000 | 4.000 | 130.600 | 34.122 | 3.113 | |
| Std Dev | 5.437 | 3.314 | 5.092 | 3.108 | 1.599 | 23.623 | 2.219 | 4.642 | 1.366 | 30.427 | 1.333 | 0.227 | |
| SPAIN | Average | 3.672 | 15.854 | 4.333 | 106.530 | 3.286 | 144.811 | 1.785 | 2.200 | 2.070 | 68.306 | 43.809 | 0.199 |
| Min | 0.700 | 8.280 | −5.078 | 96.624 | 1.630 | 103.037 | −3.134 | −16.800 | −1.100 | 35.590 | 38.307 | 0.032 | |
| Max | 9.381 | 25.990 | 13.630 | 113.049 | 5.820 | 205.257 | 5.054 | 13.600 | 4.300 | 100.367 | 48.602 | 0.618 | |
| Std Dev | 2.692 | 5.699 | 5.758 | 4.422 | 1.060 | 32.968 | 2.347 | 8.150 | 1.457 | 24.255 | 3.019 | 0.192 | |
| ITALY | Average | 9.703 | 9.299 | 5.517 | 99.455 | 3.751 | 129.285 | 0.307 | 0.035 | 1.775 | 115.196 | 22.956 | 4.953 |
| Min | 5.300 | 6.190 | −0.049 | 93.330 | 1.530 | 88.532 | −3.501 | −7.500 | 0.000 | 99.792 | 20.625 | 3.826 | |
| Max | 16.543 | 12.470 | 11.725 | 105.949 | 5.810 | 155.976 | 4.028 | 8.800 | 3.700 | 131.785 | 23.994 | 7.016 | |
| Std Dev | 3.862 | 1.900 | 3.620 | 4.010 | 1.110 | 18.464 | 1.815 | 3.833 | 1.037 | 13.036 | 0.887 | 0.727 | |
| GERMANY | Average | 3.325 | 6.703 | 3.648 | 92.345 | 3.515 | 120.225 | 1.329 | 0.700 | 1.530 | 67.474 | 23.153 | 0.010 |
| Min | 1.200 | 3.190 | −2.958 | 86.410 | 1.280 | 97.704 | −3.283 | −3.800 | 0.100 | 56.704 | 21.665 | 0.010 | |
| Max | 5.200 | 10.690 | 9.225 | 99.489 | 5.350 | 150.640 | 5.083 | 5.300 | 3.100 | 80.956 | 24.920 | 0.010 | |
| Std Dev | 1.134 | 2.418 | 3.363 | 4.040 | 1.329 | 18.288 | 1.920 | 2.427 | 0.694 | 7.452 | 1.029 | 0.000 | |
| FRANCE | Average | 3.802 | 9.062 | 4.516 | 95.576 | 3.424 | 120.959 | 1.326 | 3.125 | 1.575 | 79.884 | 23.422 | 4.264 |
| Min | 2.500 | 7.360 | 1.371 | 89.889 | 1.220 | 108.930 | −1.748 | −4.700 | 0.100 | 58.344 | 21.908 | 3.533 | |
| Max | 5.000 | 10.450 | 7.990 | 102.441 | 5.260 | 138.512 | 3.391 | 13.300 | 2.800 | 98.669 | 25.873 | 5.892 | |
| Std Dev | 0.765 | 0.815 | 2.020 | 3.958 | 1.208 | 9.577 | 1.197 | 5.136 | 0.716 | 15.374 | 1.306 | 0.543 | |
| NETHERLANS | Average | 2.278 | 4.983 | 4.685 | 100.926 | 3.986 | 125.642 | 1.494 | 1.115 | 1.890 | 55.461 | 27.434 | 2.302 |
| Min | 1.500 | 3.190 | −0.445 | 92.695 | 2.140 | 112.723 | −2.622 | −7.900 | −0.100 | 42.995 | 25.188 | 1.954 | |
| Max | 3.400 | 7.710 | 11.314 | 109.437 | 5.380 | 139.763 | 4.190 | 7.400 | 5.100 | 67.858 | 29.721 | 2.956 | |
| Std Dev | 0.626 | 1.306 | 3.569 | 4.885 | 0.991 | 8.177 | 1.709 | 4.379 | 1.153 | 7.355 | 1.460 | 0.300 | |
| BELGIUM | Average | 2.799 | 7.535 | 4.562 | 100.209 | 3.378 | 74.515 | 1.622 | 2.490 | 1.960 | 101.015 | 25.264 | 0.494 |
| Min | 1.400 | 5.240 | −0.851 | 93.641 | 1.470 | 60.755 | −2.258 | −1.100 | −0.400 | 87.029 | 24.134 | 0.322 | |
| Max | 4.300 | 8.740 | 9.845 | 104.501 | 5.250 | 91.723 | 3.735 | 9.700 | 3.400 | 108.771 | 26.744 | 0.867 | |
| Std Dev | 0.801 | 1.000 | 2.878 | 2.922 | 1.063 | 9.616 | 1.304 | 2.702 | 0.955 | 5.860 | 0.760 | 0.120 |
Table 3.
Model estimates (significant at 5% level).
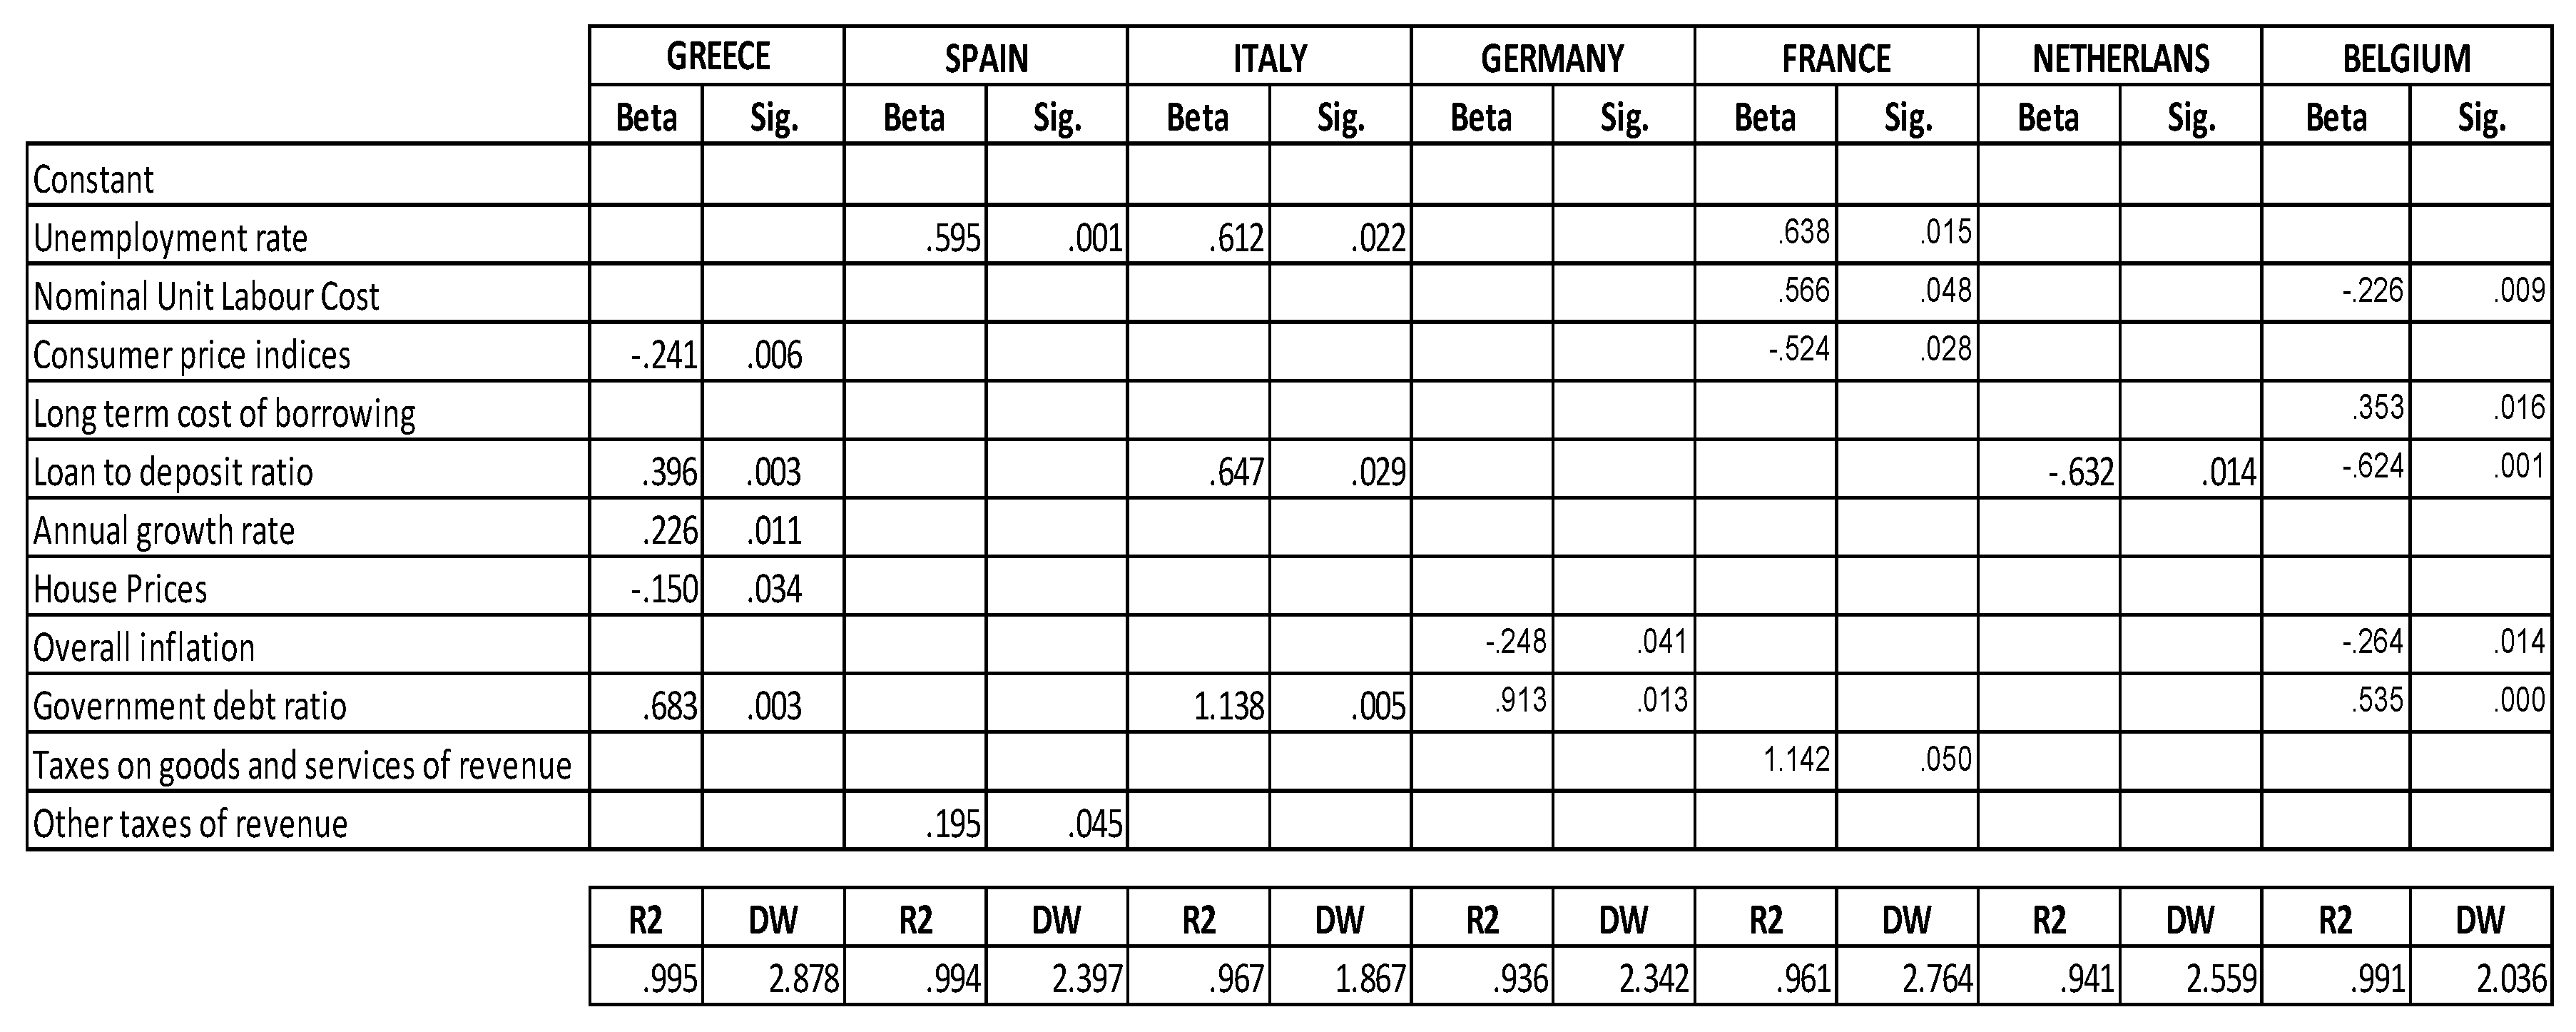
Table 4.
Correlation among Hofstede indicators. Source: www.hostede-insights.com.
Table 4.
Correlation among Hofstede indicators. Source: www.hostede-insights.com.
© 2021 Copyright by the authors. Licensed as an open access article using a CC BY 4.0 license.